Download
1 / 20
200 likes | 310 Vues
Ambiguity: Using Multiple Techniques Joint ICTP/IAEA Workshop on Advanced Simulation and Modelling for Ion Beam Analysis 23 - 27 February 2009, Miramare - Trieste, Italy. Chris Jeynes University of Surrey Ion Beam Centre Guildford, England Wednesday February 25 th 2009. Contents.

E N D
Ambiguity: Using Multiple TechniquesJoint ICTP/IAEA Workshop on Advanced Simulation and Modelling for Ion Beam Analysis23 - 27 February 2009, Miramare - Trieste, Italy Chris Jeynes University of Surrey Ion Beam Centre Guildford, England Wednesday February 25th 2009
Contents • Ambiguity in principle: Alkemade’s (N-1) • The centrality of the collected charge • What the spectrum tells you • Demonstrable ambiguity: Butler & chemical priors • Molecules • Multiple spectra
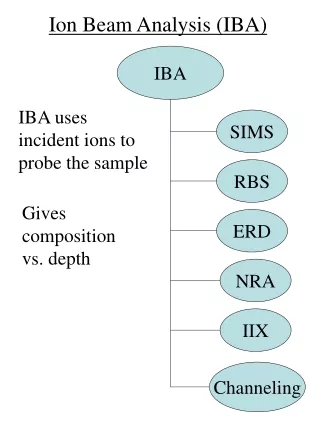
Previous Work Two contributions at the 1989 IBA Conference, Kingston, Canada • Alkemade P F A, Habraken F H P M and van der Weg W F, 1990: On the ambiguity in the analysis of Rutherford backscattering spectra Nucl. Instrum. Methods B 45 139–42 Shows that spectra are less ambiguous than one might think: if there are N elements in the sample you need N-1 independent spectra for solution • Butler J W, 1990: Criteria for validity of Rutherford scatter analysis, Nucl. Instrum. Methods B 45 160–5 Shows that there are some strictly ambiguous spectra, but that chemical prior knowledge imposed on the data can enable an unambiguous solution These are discussed in detail in: • C Jeynes, N P Barradas, P K Marriott, G Boudreault, M Jenkin, E Wendler and R P Webb, 2003: Elemental thin film depth profiles by ion beam analysis using simulated annealing—a new tool, J. Phys. D: Appl. Phys. 36 (2003) R97–R126 (Topical Review)
Real RBS Spectrum of a-Sia-Si, 2MeV, 3.840(8)keV/ch, 1.95(2)msr, 150.0(2)0 scattering angle, 46.0(5)mC AA = Q NAs´A(E, q)W Y0,A = Q fAs´AW D / [e0] AAB Doesn’t tell us: Energy, gain D BUT: given[e] , E, D it does tell us Q*W G. Lulli, E. Albertazzi, M. Bianconi, G.G. Bentini, R. Nipoti, R. Lotti, Nucl. Instrum. Methods B170 (2000) 1.
Electronic Gain(see detailed treatment in Pitfalls II) • what is ambiguous here? • Energy! • offset is fitting parameter C. Jeynes, N. P. Barradas, M. J. Blewett, R. P. Webb, Nucl. Instr. and Meth. B 136-138 (1998) 1229
Starting structure Simulated Annealing fits with uncertainties by Bayesian Inference High noise Medium noise Low noise Barradas N P, Jeynes C, Jenkin M and Marriott P K, 1999, Bayesian error analysis of Rutherford backscattering spectra, Thin Solid Films 343–344 31–4 Charge Ambiguity You don’t need as much collected charge as you might have thought !! Microbeam RBS analysis works fine !! 0.1mC 1mC 10mC 2.5msr
Si Si SiO2 Si+SiO2 29uC 23uC 2MeV 4He 2MeV 4He 102uC 70uC 11B(p,g)12C 152-256keV 11B(p,g)12C 152-256keV Co/Fe=3.8 (PIXE) Co/Fe=3.8 (PIXE) M:B:Si = 26:58:16 M:B:Si = 37:45:18 Effect of unknown charge in RBS/PIXE/PIGE analysis of FeCo borosilicide on oxidised Si(self-consistent analysis by NDF)
W.P.Lee, V.R.Gundabala, B.S.Akpa, M.L.Johns, C.Jeynes, A.F.Routh, Distribution of Surfactants in Latex Films: an RBS study, Langmuir 2006, 22, 5314-5320 Note fit is good! O Na F S C Latex Note non-zero concentration Surfactant (ST) Charge Ambiguity Latex=poly(butyl acrylate co styrene) Applications: water-based gloss paint, glue etc Surfactant= SDS, SOS, LiDS, ST Nominal compositions: Latex: (C,H,O) = (390,520,52) SDS: (C,H,O,S,Na) = (12,25,4,1,1) SOS: (C,H,O,S,Na) = (8.17,4,1,1) LiDS: (C,H,O,S,Li) = (12,25,4,1,1) ST: (C,O,S,Na,F) = (1,3,1,1,3) Interest is in the equilibrium near-surface (1mm) concentration of surfactant, to explore the models of drying The low energy RBS signal had to be used to obtain the composition (the latex:surfactant ratio). The spectra had to be handled very precisely Marangoni flow instabilities large lateral inhomogeneity (~50 spectra) Bulk surfactant: 1.3 ± 0.2 at%
Force low energy signal to fit 1.5MeV 4He+ q = 1600 2.5MeV 4He+ q = 1650 1.4.1018 200keV 1800C N.P.Barradas, C.Jeynes, S.M.Jackson, RBS/simulated annealing analysis of buried SiCOx layers formed by ion implantation of O into cubic silicon carbide, NIM B136–138, 1998, 1168–71 Many repeated measurements + unifom analytical procedure = internal consistency Therefore: procedure valid! Charge Ambiguity Great precision can be obtained if proper care in fitting the data is taken Using background fitting method of Barradas, Jeynes & Jackson Then light elements can be quantified with confidence, even by RBS alone Map B/C in BC film Form buried oxide in SiC A.Simon, T.Csákó, C.Jeynes, T.Szörényi, High lateral resolution 2D mapping of the B/C ratio in a boron carbide film formed by femtosecond pulsed laser deposition, NIM B249, 2006, 454–457
Spectral Ambiguity Average Z is determined by the charge.solid angle product (“charge”) –-- it’s not a free parameter! Invisible elements usually have quite small energy loss and are therefore very sensitive to the exact value of the charge Charge is generally not very well determined and therefore the invisible elements are not well determined Small errors in the charge can give very large errors in invisible elements Spectra from complex samples are frequently very hard to determine the charge from and therefore very easy to misunderstand Obtaining direct information from the “invisible” elements (i.e. making them visible) reduces scope for error.
Spectral Ambiguity O Al Ni Cr Original profile Oxidised NiCrAl alloy Spectrum calculated from profile Can we recover the profile from the spectrum? Variety of Cr profiles are possible Yes, we can! But not unambiguously! Re-analysis of an oxidized NiCrAl alloy (following J.W.Butler, Criteria for validity of RBS analysis, NIM B45, 1990, 160-165) Figure is reproduced from Jeynes et al J.Phys.D: Appl.Phys. 36, 2003, R97-R126
Spectral Ambiguity Specifying only elements barely constrains the profile, and even with two detectors the profile is not recovered at intermediate depths. Using only one detector with the assumption of molecules is also not sufficient. Molecules used are NiO, Cr2O3, Al2O3 and (Ni195 Cr186 Al119). Wiiliam of Occam (c1285-1347?) IBA spectra are inherently ambiguous and there exist multiple valid solutions Re-analysis of an oxidized NiCrAl alloy (Butler 1990) (a) Original profile from which the spectrum was calculated (b) Spectrum (symbols) and fit (line) (c) Atomic profile fitted to data assuming molecules and complete oxidation from the surface, using two spectra at different detector angles, and excluding alumina from the surface (d) Comparison with the original profile of the Cr profile calculated under various assumptions Occam’s Razor: non sunt multiplicanda entia praeter necessitatem (“minimise your assumptions”)
Wiiliam of Occam (c1285-1347?) Spectral Ambiguity • To avoid ambiguity in Butler’s example we needed • The stated molecules present • Only oxides at the surface • No O in substrate • Al excluded from near-surface region • Multiple spectra (not mentioned explicitly by Butler) • The spectra are systematically ambiguous • That is, a variety of solutions we know to be wrong are nevertheless perfectly valid. • A bad fit means that: • you have an invalid(an incorrect) solution • A good fit means that: • you have a validsolution • but not necessarily a correctone!
Incident Ion Sample To detector C.Jeynes++ Surface & Interface Analysis 30 (2000) 237-242 Molecules contra AmbiguityRutherford BackScattering • Energy of ions scattering from nuclear collisions depends on mass and depth • Detection limit around 0.1% • Depth profiling with depth resolution <20nm • Analytical cross-section s (Coulomb potential) • Single scattering (cf electron backscatters in SEM) sproportional to Z2/E2 2MeV 4He • Coulomb potential (accurate) • Perfect fitting of complex structures (inverse problem solved) RBS Spectrum of zirconia/silica multilayer optical coating (red), with DataFurnace fit (green)
Molecules contra Ambiguity 2 angles 00 & 450 2 molecules (glass substrate) C.Jeynes++ Surface & Interface Analysis 30 (2000) 237-242
Wiiliam of Occam (c1285-1347?) Molecules Five reasons for using molecules (Occam’s Razor): • Reduce number of free parameters • state space dimensionality increases with number of elements • Better to constrain invisible elements with chemical priors • Correlate direct signals for light & heavy elements • low sensitivity to light elements • Allows other “complex” priors to be applied consistently • eg: “glass substrate” • eg: “silicide only near surface” • Orthogonalise the problem • eg: determine substrate composition first
Multiple TechniquesElastic Recoil Detection 1.5MeV 4He RBS Normal incidence Glancing incidence simultaneous with: ERD SiNx:H on Si Ga implant to form a-GaNx? Barradas et al, NIM B148, 1999, 463 Depth profile with uncertainties Using Bayesian Inference Jeynes et al J.Phys.D 36, 2003, R97 ERD
N.P.Barradas, S.Parascandola, B.J.Sealy, R.Grötzschel, U.Kreissig, Simultaneous and consistent analysis of NRA, RBS and ERDA data with the IBA DataFurnace,NIM B161–163, 2000, 308–13 only shallow signal no deep signal channels displaced <5% 1H2 contamination Multiple TechniquesRBS/NRA/HI-ERD Austenitic stainless steel (AISI 321, Cr18Fe65Ni12) nitrided 4 h at 380°C by plasma immersion ion implantation (PIII). 35 MeV 35Cl ERD: angular resolved ionisation chamber 280mm 38mb isobutane “in situ” plus 1.5mm mylar range foil, 330keV TOF: 60nm C foil for start, 284keV 1.4MeV d-RBS: detector resolution 17keV 1.4MeV 14N(d,a1)12C NRA: Q=9.146MeV, 17keV in situ ERD: high resolution ToF-ERD: looks deeper NRA: sees all the N RBS: sees the metals
does fit! does not fit! Multiple TechniquesRBS/PIXE M.A. Reis, N.P. Barradas, C. Pascual-Izarra, P.C. Chaves, A.R. Ramos, E. Alves, G. González-Aguilar, M.E.V. Costa, I.M. Miranda Salvado, Holistic RBS–PIXE data reanalysis of SBT thin film samples, NIM B261. 2007, 439–442 SBT=SrBi2Ta2O9: bismuth layered perovskite interesting ferroelectric spin coated thin films on Si/SiO2/Ti/Pt substrates grazing incidence XRD: confirms perovskite structure with no second phases PIXE line areas from AXIL Details of the process (seeding, non-stoichiometry, interface diffusion, impurities) can be explored in detail with self-consistent PIXE/RBS Occam’s Razor! Good assumptions need holistic PIXE/RBS! Bad assumptions PIXE & RBS not integrated
Summary • IBA data can be highly ambiguous • Reduce ambiguity by using: • Multiple detectors (simultaneous data collection) • Multiple geometries (simultaneous or sequential data collection) • Multiple beams (sequential data collection) • Multiple techniques (simultaneous or sequential data collection) • Strictly control prior assumptions with Occam’s Razor • Molecules (chemical priors) • Number and position of layers (physical priors) • Interface assumptions (roughness, diffusion etc) • Explicitly and carefully determine all experimental parameters (!!) • Write up properly (!!)