Download
1 / 24
240 likes | 387 Vues
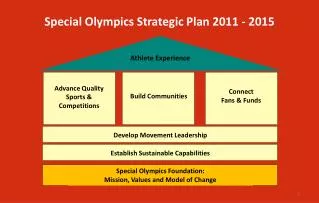
Special Olympics Strategic Scorecard . Overview and Status February 2007. Purpose of a Scorecard. Provide centralized, top-level evaluation of the movement’s accomplishments Provide Programs with benchmarks and best practices Align the organization to the strategic goals

E N D
Special Olympics Strategic Scorecard Overview and Status February 2007
Purpose of a Scorecard • Provide centralized, top-level evaluation of the movement’s accomplishments • Provide Programs with benchmarks and best practices • Align the organization to the strategic goals • Drive performance and accountability at all levels
Existing Measurement Systems Existing systems provide source data for many performance measures, but do not suffice alone as a single source of performance metrics or “scorecard”
Learnings from 2000-2005 Census • “Grass roots” level data is hard to collect • Variable operating models across Programs • Limited systems to support operations and data collection • Measurement requires culture change • Are imperfect measures acceptable?
Determining what to measure • Framework: 2006-2010 Strategic Plan • The objectives for selecting metrics were: • Broaden the current set of metrics that are regularly evaluated • Identify 2 to 3 metrics per Strategic Goal • Define strategic measures and then evolve to more specific or operational measures • Align performance measurement to the movement’s strategy • Reinforces communication of the strategic goals
Principles • Provide value for Program and Regional leaders • Keep it simple and then evolve • Consider efforts required by Programs • Balance ideal metrics with the cost of acquiring them • Consider “80/20 rule” for collecting data or implementing new measures
Possible Metrics – Revenue Goal To build a movement-wide diversified and sustainable revenue stream of $300 million per year High • Revenue by source (audited financials) • Value of volunteers • Cost of Fundraising (revenue efficiency; US only) • Revenue figures used to calculate accreditation fees Effort to Obtain • Cash donations and VIK from PDS • Gross Revenues from IRS 990s Preferred quadrant Low High Low Value of Data
Possible Metrics – Communications Goal To expand and engage key audiences with a compelling message to inspire new levels of support and change attitudes toward people with intellectual disabilities High • # of spectators at SO competitions • Media impressions • # of volunteers from PDS • # of Global messenger appearances • # of families from PDS Effort to Obtain • # of Unified partners from PDS • #of Global Messengers • Longitudinal attitude study in key markets • CDMP impressions / response rates • Past Attitude surveys (14 nations) Preferred quadrant Low High Low Value of Data
Possible Metrics – Quality Goal To enhance the quality of the local athlete experience, recognizing individual motivations and aspirations for sport performance High • Athlete satisfaction survey • Competitions by level • Coaches demographics, certifications • Program expense as % of budget (US only) Effort to Obtain • # of Coaches and Competitions from PDS • Evaluation of Maximum Potential • Unified Growth • ALPs participation • Athlete to Participant ratio from census Preferred quadrant Low High Low Value of Data
Possible Metrics – Organizational Effectiveness To become a unified and integrated global movement with a common focus on the interests of our core constituents High • # of Programs with strategic plans aligned to regional and global goals • # of Programs with complete and current PDS data • # of sub-Programs Effort to Obtain • Program expense as % of budget (US only) • # of Programs on CRM / Collaborative Fundraising • Program survey results • Accreditation compliance • Organizational DNA survey (SOI only) • Mission compliance Preferred quadrant Low High Low Value of Data
Possible Metrics – Growth Goal To grow to at least 3 million athletes High • Return on CRG investments Effort to Obtain • Young Athlete program results • Urban Initiative program results • Athlete participation (incremental effort) Preferred quadrant Low High Low Value of Data
Metrics Progression – Revenue Goal Initial More informative
Metrics Progression – Communications Goal Initial More informative
Metrics Progression – Quality Goal Initial More informative
Metrics Progression – Organizational Effectiveness Additionally, SOI will evaluate and propose recommendations to link strategic goals, metrics, Accreditation and PDS into a more integrated, user-friendly approach for directing and evaluating the movement’s effectiveness.
Metrics Progression – Growth Young Athletes (under age 7) will be incorporated into census beginning in 2007
Potential Analysis – 2006 Baseline • 2006 baseline: Cash, VIK, Coaches, Competitions and athlete participation (across all Programs) • Key audience: SOI Leadership • Strategic Questions that data may help to answer: • What is our current revenue baseline? • What geographic areas have the greatest revenue potential? Are regional resources appropriately aligned? • What are our current levels of VIK support? • Is the trend in Athlete/Participant ratio improving? • How do levels of coaches / competitions impact athlete experience? • Is the movement still growing the number of participating athletes?
Evaluating multiple Programs across combinations of metrics can identify Programs with best practices and Programs needing additional support and guidance Key audiences: Programs (by peer group), Regions, SOI Executives Potential Analysis – Benchmarking and Identifying Best Practices Illustrative 12 Leveraged Resources, Reliance on local competitions Appropriate allocation of resources; Sponsored competition events - Program 1 - Program 6 - Program 7 • Program peer groups could be determined by: • Program size (athletes or budget) • Developmental level (PDS) • Within Region or across Regions - Program 2 - Program 4 Competitions per Athlete 5 Resource constraints impacting Athlete experience Questionable allocation of resources - Program 9 - Program 5 - Program 8 - Program 3 Median within peer group 0 $0 $100 $200 Revenue per Athlete
Exercise caution when drawing conclusions Excellent performance in one area may not show challenges in another Potential Analysis – Benchmarking and Identifying Best Practices Illustrative 2 Restrained Growth Quality Growth - Program 6 - Program 1 - Program 7 - Program 2 Athlete / Participant Ratio - Program 4 .5 Growth declines impacting Athlete experience Growth negatively impacting quality - Program 5 - Program 9 - Program 3 Median within peer group - Program 8 0 -1,000 0 +2,000 Growth Rate (2000-2006)
Potential Analysis – Program “Scorecard” • With modifications in PDS, it is possible to provide each Program with their own scorecard that tracks progress in each metric and identifies benchmarks and best practices Illustrative
Next Steps • Collection of 2006 baseline Jan-Mar • Metrics briefing @ US Business Meeting Feb • Develop peer groups w/ Regions Feb-Mar • Compile and analyze 2006 baseline Mar-Apr • Prepare first Strategic Scorecard report May • Board discussion on Scorecard results Jun