Download
1 / 28
280 likes | 679 Vues
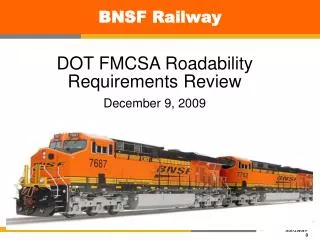
BNSF Railway. Presentation for Caltrans Planning Horizons March 12, 2001. U.S. Freight Rail System. BNSF’s Vision.

E N D
BNSF Railway Presentation for Caltrans Planning Horizons March 12, 2001
BNSF’s Vision Our vision is to realize the tremendous potential of the Burlington Northern and Santa Fe Railway by providing transportation services that consistently meet our customers’ expectations.
BNSF Facts New Product Development • 48-hour service from Chicago to San Bernardino • Guaranteed Intermodal Service • Guaranteed Carload Service New Alliances and Partnerships • Mexi-Modal service with CN, CSX, TexMex and TFM • Ice Cold Express service with CSXT • Joint service with NS to East Coast
BNSF Facts Premium Intermodal Service • Southern Cal to North East (NY/NJ) on NS - 3-4 day service • Southern Cal to Atlanta on CSX - 3-4 day service Reliable Performance • 1999 to 2002 on-time performance averaged 90% • During peak season between Thanksgiving and Christmas, BNSF ships more than 50 million packages for UPS--on time!
BNSF Facts BNSF Revenues by % of Freight Ag 17% Coal 23% Intermodal 32% Industrial 23% Auto 5%
BNSF Tracks UP Tracks Trackage Rights On UP Other Railroads (i.e. ARZC) BNSF Map of Facilitiesin California MCR • Port Facilities listed in Red • Rail served Intermodal ramps listed in Green • IMX facilities in Grey • Automotive Facilities shown with icon. CFNR Port of Richmond Richmond Port of Oakland Sacramento Stockton SERA Modesto CFNR Fresno SJVR SJVR SUN Barstow Port of Wilmington (Watson) Los Angeles SCRA SCRA San Bernardino Port of Los Angeles Port of Long Beach SCRA ARZC SDNR SDIY Port of San Diego San Diego National City
To Sacramento& San Francisco Alameda Corridor East40% of Alameda CorridorContainer Traffic(Union Pacific) Corridor North 20% of AlamedaCorridor Traffic(Union Pacific) Burbank To EasternUnited States Los AngelesRedondo Junction Orange County Gateway40% of Alameda CorridorTraffic (BNSF) Ontario Hobart Yard Santa Fe Springs To Texas &Eastern US LAX Airport La Habra Brea Yorba Linda Alameda Corridor Placentia Fullerton Container Traffic: 60% Union Pacific40% BNSF Buena Park Anaheim Disneyland Orange Port ofLong Beach HuntingtonBeach Port ofLos Angeles John Wayne Airport Irvine To San Diego & Mexico ContainerDistribution Percentages
Intermodal Volume Line thickness corresponds to Intermodal volume San PedroBay Ports $250 billion in new International trade will flow through our ports in 2020. Source: Double Stack Container Systems: Implications for U.S. Railroads and Ports (US Dept. of Transportation, Washington DC, 1990)
BNSF FactsBNSF Southern California (LA & SB)Intermodal Intermodal Facility Lifts • Southern California volume has grown by 73% since 1995 (over 600,000 total lifts). • Average annual lift increase of nearly 12% (120,000 per year). • Projected Southern California 2002 volume increase of approximately 150,000 units
BNSF Facts Hobart Lifts Current Capacity
Freight Railroad Facts Critical resource • U. S. Railroads move 40% of the nation’s intercity freight Insufficient returns • U. S. Railroads reap only 10% of the revenues • Since 1980, freight rail rates (adjusted for inflation) have dropped about 20% Capital intensive • From 1995 to 2001, BNSF $12.5 billion to improve its infrastructure - rails, ties, ballast, bridges, tunnels, yards and facilities • Cost of Capital is in same range as Return on Invested Capital Unsubsidized Private Sector Entity
“In my opinion, the equity markets are slowly losing their patience with railroads as an investment as they continue to wait for the promised land of adequate returns, and may eventually turn their backs on the industry.”-- James J. Valentine, Morgan Stanley Analyst
Pressures Will Continue Capacity: U.S. DOT says freight traffic will double in 20 years. Service Quality: Rail customers to demand better service. Highway Congestion: Continual pressure to reduce congestion, emissions, fuel use, and enhance safety. Passenger: Increased demands for passenger use of freight-owned track.
Freight Railroad Facts Environmentally Sound • Rail is less polluting than other land transportation modes for all criteria pollutants • New technology is creating ever-cleaner locomotives
Public-Private Partnerships to Solve the Infrastructure Dilemma Primarily for projects whose main purpose is to provide public benefits or meet public needs. Opportunity for transportation planners and providers to meet vital needs efficiently and effectively. Maintain budget “firewalls” and preserve existing funding frameworks. Combines efficiency of private sector with the equity of public participation.
1. Section 130: Increase Funding, Include Maintenance 155,000 public crossings nationwide. Currently ~$155 million per year STP set-aside. Has prevented 40,000 serious injuries, 10,000 fatalities since 1974. RRs spend >$200 million per year on crossings.
2. CMAQ: Increase Funding, Clarify Freight Rail Eligibility Funds variety of projects to reduce congestion and transportation-related emissions. Currently a too-low ~$1.5 billion per year. Has funded a few freight rail-related projects.
3. Corridors and Borders: Increase Funding, Liberalize Eligibility Funds projects that serve border regions and high priority corridors. Current funding of ~$140 million per year is too low. Clarify that E-W (not just N-S) traffic is eligible, and fund projects > 100 miles from a border if traffic is largely international.
4. Encourage State and Local Transportation Planners to Consider Freight Issues Transportation projects are prioritized by state planning organizations or, for urban projects, by MPOs. Existing planning focuses on highway and transit. Too-little attention paid to freight mobility, particularly rail.
5. Tax-Exempt Rail Infrastructure Investment Income tax exclusion on interest for debt used to fund investment in "Qualified Railroad Property" (QRP). Expenditure for acquisition or maintenance of depreciable property (e.g., track, bridges, terminals). Counterbalance to public subsidies provided heavy trucks and barges.
6. Tax Incentives For Intermodal Investment Intermodal is efficient, saves fuel, reduces congestion, and enhances safety. Tax benefits available to all industries. Recognizes huge societal benefits of intermodal.
7. Expand RRIF Program, Remove Restrictive Requirements Provides low-interest loans and loan guarantees for RR capital investments. Raise loan balance from $3.5 billion to $35 billion. Eliminate lender of last resort and collateral requirements. Helps railroads of all sizes, especially short lines.
Summary Daunting growth forecast. Infrastructure is preeminent issue. Tap public/private partnerships. 7 proposals for Reauthorization