Download
1 / 41
410 likes | 516 Vues
Ensemble Forecasting from LPJ simulations over the Mediterranean basin: Preliminary Results. Dr. Monia Santini University of Tuscia and CMCC. CMCC Annual Meeting Marina di Ugento (LE) June 9 th -11 st , 2010. A im.

E N D
EnsembleForecastingfromLPJsimulations over the Mediterranean basin: Preliminary Results Dr. Monia Santini University of Tuscia and CMCC CMCC Annual Meeting Marina diUgento (LE) June 9th-11st, 2010
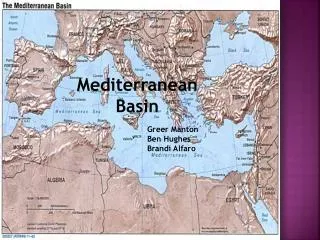
Aim To analyze uncertainties in projections of Med-basin natural vegetation trends for the 21st century from the DGVM-LPJ, based on future global and regional climate simulations, on model parameterization and formulations.
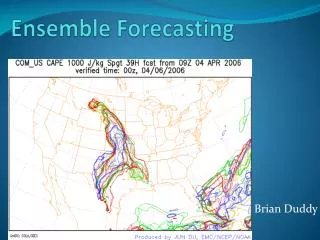
Ensemble Forecasting (Araujo and New, 2007) “…each individual outlook to the future in a scenario-study will not necessarily contain the most likely prospects, but, as a whole, the simulations provide the bandwidth of possible changes.” (Dammers, 2000). • Initial condition perturbation • The ensemble spread gives information about the prediction errors
LPJ inputs/outputs • Spatialized inputs • Soil: texture • Climate: monthly temperature, precipitation, cloud coverage, number of wet days • Aggregated inputs • CO2 concentration • Average grid-cell basis outputs: • Monthly: carbon and water fluxes • Annually: carbon pools , fire return period, and competition among 9 Plant Functional Types (PFTs) + barren areas http://www.pik-potsdam.de/lpj/
Sources of LPJ uncertainties Model inputs: future climate projections Representation of driving processes and/or model formulation Parameters within the model (e.g. Zaehle et al. 2005; Anav, 2009) regarding soil and/or PFTs
Sourcesof LPJ uncertainties Future climate projections 1971-2050 A1B
Sources of LPJ uncertainties Model formulation • Daily precipitation generation: • Interpolation from monthly data • Random generation from precipitation amount and number of wet days PRECIPITATION (mm) • Monthly precipitation =256 mm • Number of wet days = 12 • Monthly precipitation next month =20mm DAY OF MONTH
Sources of LPJ uncertainties PFT parameters TNE = Temperate Needleleaved Evergreen TBE = Temperate Broadleaved Evergreen TBS = Temperate Broadleaved Summergreen BNE = Boreal Needleleaved Evergreen C3 = C3 grass
Input data processing Soil (HSWD) 0.0083333° (≈1 km) 0.083333° (≈10 km) LPJ soil parameterization COARSE MEDIUM COARSE MEDIUM FINE COARSE FINE MEDIUM FINE MEDIUM COARSE FINE NONVERTISOL FINE VERTISOL ORGANIC (Harmonized Soil World Database; IIASA, 2009)
Input data processing • Soil (HSWD) 0.0083333° (≈1 km) 0.083333° (≈10 km) • Climate interpolated to aggregated soil grid (natural neighbouring) CMCC grid
Input data processing • Soil (HSWD) 0.0083333° (≈1 km) 0.083333° (≈10 km) • Climate interpolated to aggregated soil grid (natural neighbouring) ENEA grid
Input data processing • Soil (HSWD) 0.0083333° (≈1 km) 0.083333° (≈10 km) • Climate interpolated to aggregated soil grid (natural neighbouring) CNRS-IPSL grid
Input data processing • Soil (HSWD) 0.0083333° (≈1 km) 0.083333° (≈10 km) • Climate interpolated to aggregated soil grid (natural neighbouring) METEOFRANCE grid (regular)
Input data processing • Soil (HSWD) 0.0083333° (≈1 km) 0.083333° (≈10 km) • Climate interpolated to aggregated soil grid (natural neighbouring) METEOFRANCE grid (irregular)
Input data processing • Soil (HSWD) 0.0083333° (≈1 km) 0.083333° (≈10 km) • Climate interpolated to aggregated soil grid (natural neighbouring) MPI grid
Input data processing • Soil (HSWD) 0.0083333° (≈1 km) 0.083333° (≈10 km) • Climate interpolated to aggregated soil grid (natural neighbouring) • CO2-5 years interpolated to 1 year IMAGE Team, 2001
LPJ simulation protocol Perform 24 separated runs of LPJ Spin-up period of 1000 years (from 971 to 1970) Transient simulation from 1971 to 2050
Whole-domain climate input anomalies ‘Temperature’ anomaly Relative to 1971-2000 (all model average) ANOMALY ‘Number of wet days’ anomaly YEARS ANOMALY YEARS
LPJ outputs For each grid cell LPJ producesannual values for: Plant Functional Types Vegetation carbon Soil carbon Litter carbon Carbon loss by fires Fire return period ...and monthlyvalues for: • Net Primary Production • Heterotrophic Respiration • Run-off • Evaporation • Interception • Transpiration • Soil moisture (2 layers) NEE Blue water fluxes White water fluxes (unproductive) Green water fluxes (productive)
PFT percent distribution TEMPERATE NEEDLELEAVED EVERGREEN 2000
PFT percent distribution TEMPERATE NEEDLELEAVED EVERGREEN 2050 2000
PFT percent distribution C3 PERENNIAL GRASS 2000
PFT percent distribution C3 PERENNIAL GRASS 2050 2000
Litter C - aggregated average gC/m2 YEARS YEARS
Soil C - aggregated average gC/m2 YEARS YEARS
Vegetation C - aggregated average gC/m2 YEARS YEARS
C loss by fires - aggregated average gC/m2 YEARS YEARS
Fire probability - aggregated average YEARS YEARS
Spatial “litter C” anomalies 2021-2050 minus 1971-2000, whole ensemble average
Spatial “soil C” anomalies 2021-2050 minus 1971-2000, whole ensemble average
Spatial “vegetation C” anomalies 2021-2050 minus 1971-2000, whole ensemble average
Spatial “C loss by fires” anomalies 2021-2050 minus 1971-2000, whole ensemble average
Spatial yearly Blue Water anomalies 2021-2050 minus 1971-2000, whole ensemble average
Spatial yearly Green Water anomalies 2021-2050 minus 1971-2000, whole ensemble average
Spatial yearly NPP anomalies gC/m2 2021-2050 minus 1971-2000, whole ensemble average
First conclusions • At aggregated level, different ensemble members have a variable influence in function of the considered model output. • At spatialized level: • two different behaviors between N and S Med-basin for C-related fields • Med-surrounding areas the most critical in terms of water resources and fires
in progress and future work Validation (last decade) at eddy sites (other EU-projects)
in progressand future work Forcing with land use change simulations to separate natural vegetation from croplands focusing on fires Input to Historical analysis of LUC Land use change scenarios from coupled ICES+CLUE@CMCC Input to drive Climate projections Input to LPJ model result LU/LC maps: URBAN CROPLAND detail from ICES+CLUE@CMCC FORESTLAND/GRASSLAND detail from LPJ model Carbon loss by fires Fire return interval Output for Impacts at the RUI
in progress and future work Ensemble updating using other GCMs-RCMs and/or emission scenarios (e.g. AR4 and AR5) e.g. COSMO-CLM domain (14 km res.) Temporal coverage 2000-2100
in progress and future work Forcing with land use change simulations to separate natural vegetation from croplands focusing on White, Green & Bluewater fluxes in SSA CLIMAFRICA
Thank you! monia.santini@unitus.it