Download
1 / 9

E N D
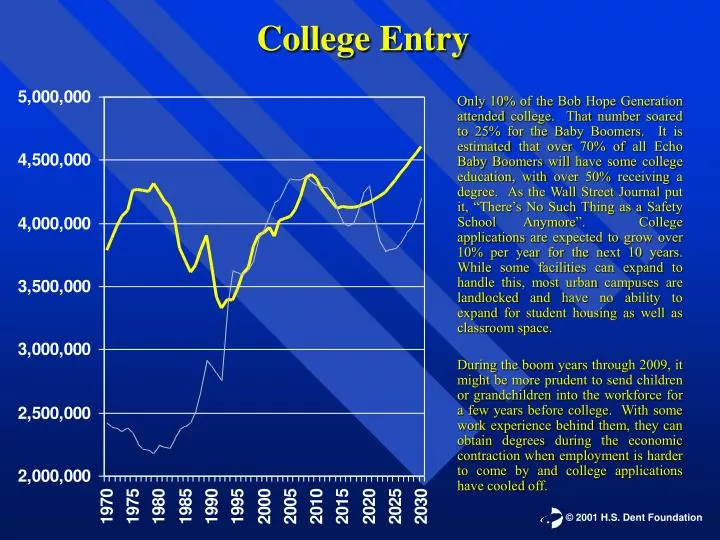
College Entry Only 10% of the Bob Hope Generation attended college. That number soared to 25% for the Baby Boomers. It is estimated that over 70% of all Echo Baby Boomers will have some college education, with over 50% receiving a degree. As the Wall Street Journal put it, “There’s No Such Thing as a Safety School Anymore”. College applications are expected to grow over 10% per year for the next 10 years. While some facilities can expand to handle this, most urban campuses are landlocked and have no ability to expand for student housing as well as classroom space. During the boom years through 2009, it might be more prudent to send children or grandchildren into the workforce for a few years before college. With some work experience behind them, they can obtain degrees during the economic contraction when employment is harder to come by and college applications have cooled off.
Workforce Entry 20 year olds-3yr lag 63 year olds-No lag
Net Workforce Change Average workforce entry is moving forward about 1 year per decade because more Americans are going to college. At the same time, Americans are working just a little bit longer, to about age 63. It is the net change of those entering the workforce, with those retiring, that gives us this measurement. This measurement can be used to estimate the long term trends of inflation. Inflation is caused by the inefficient addition of labor to the economy. When large numbers of young people enter the workforce, like the 1970’s, they must be trained, set up with equipment, and put into offices. It takes several years for them to become productive. This measurement is also a factor in finding employment. It must be considered in light of the general state of the economy, either expanding or contracting.
Multi-Family Housing/Apartments This is a function of the number of people leaving home, and the number of people getting married. The average age of marriage is moving forward about one year per decade. It coincides with the peak in shopping centers, as tenants furnish their apartments. This indicator is important not only for those who are considering moving into multi-family housing, but also for those who purchase them.
Starter Homes/1st Homes That first home purchase is one of the biggest steps in our lives as consumers. It is the beginning of the American Dream. Demand for this peaks at around age 34, and, like workforce entry, is moving forward slowly. This demand is what led to the incredible run up in housing prices during the 1980’s, which peaked around 1993-1994. This is exactly the time that many were concerned about the rising level of debt in America. However, a large portion of that debt was caused by nothing more than the Baby Boomers buying their first home. Things to consider here are the need for first homes by family members, investments in homes in this range, and the outlook for neighborhoods that are mostly composed of homes in this range.
Trade-Up Homes This is the industry that has driven our economy right through the recession of 2001. To the confusion of many an economist, housing starts and existing home sales remained strong during the entire downturn of 2000-2001. This is because Baby Boomers are currently in their peak years of demanding this class of home. Trade-Up Homes typically have a lot of square footage – over 3,000 square feet – and small yards. This is an area for caution. Many homeowners are counting on the values of their homes to increase at the same rate for another ten years. This would be improbable. It is most likely that, as Boomers move beyond their peak Trade-Up Home years, the demand will taper off and the market for this type of home will become sluggish.
Peak Spending This measure is the age at which the average head of household spends the most aggregate dollars per year. Currently, it is age 47, moving forward about one year per decade. This is the point when the average first child is about to enter college, and the Trade Up Home is being renovated and furnished. Spending does not decrease because of a decrease in earnings. Earnings, on average, continue to rise until the early 50’s. Spending decreases because of a lower level of need as children leave the home, and savings for retirement increases. This measure is an indicator of overall economic activity. This can be used as a backdrop for all of the other indicators to gauge price levels and corporate earnings.
Vacation Homes/Resort Property Not everyone buys a vacation home, lake house, or resort property. But typically when they do, it is around age 52. This is after several years of spending less money, yet having higher earnings. Understanding this market allows you to judge the best time to purchase such property as well as the best time to sell.
Retirement Homes The value of retirement property will increase dramatically as the Baby Boomers reach retirement age. The peak of retirement age for Boomers will not come until the 2020’s so this market has quite a ways to go before the peak is reached. But already we are seeing retirement communities growing at exponential rates as the first wave of Boomers move in. Consider such property well in advance of the peak.