Download
1 / 17
180 likes | 303 Vues
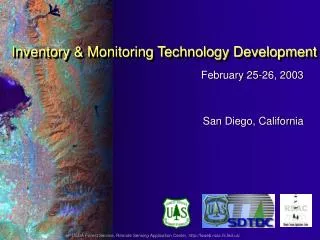
Planning for Inventory & Monitoring. Chip Scott National Inventory & Monitoring Applications Center (FIA-NIMAC) Northern Research Station U.S. Forest Service Newtown Square, PA. Inventory & Monitoring Toolkit.

E N D
Planning for Inventory & Monitoring Chip Scott National Inventory & Monitoring Applications Center (FIA-NIMAC) Northern Research Station U.S. Forest Service Newtown Square, PA
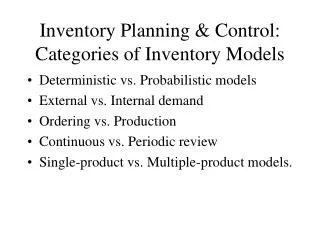
Inventory & Monitoring Toolkit • Design Tool – to identify monitoring needs, and to specify sampling design to balance cost and precision in order to address monitoring questions. • Portable Data Recorder Tool – software on PDR to collect, validate, and transfer data. • Database and Compilation Tool – to store and compute calculated fields • Spatial / Tabular Analytical Tools – use standard methods or spatial means of specifying area for which to estimate tables and maps.
The Planning Phase The Design Tool could help with the first 3 monitoring steps • Identify customers and set broad objectives – pick from list of broad objectives based on desired conditions or outcomes • Select monitoring questions – pick from list of generic questions based on the chosen objectives • Select attributes – pick from list of metrics for the questions chosen, then select from list of categorical attributes used to make tables to answer the questions. Then pick any additional attributes of interest
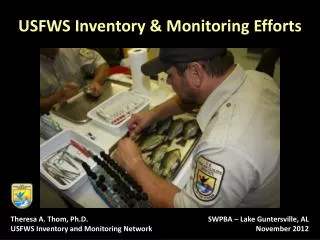
The Analysis Tool for Inventory and Monitoring (ATIM) • Access Inventory Data which meets criteria – spatially balanced, known probability of selection, metadata, etc. This includes FIA, intensified FIA, periodic, collocated, periodic, all condition inventories, etc • Access spatial datasets – associate spatial attributes with plots, selecting area of interest and determining area, post-stratification • Process (compile) data – calculate and store variables. For example tons per acre, canopy base height, canopy bulk density, classification algorithms such as old growth, dominance type, vertical structure, etc
The Analysis Tool for Inventory and Monitoring (ATIM) • Calculate estimates – include confidence intervals, sampling error, etc. Accommodate variable weights. • Query data – to process estimates, allow data exploration of tabular data • Conduct trend analysis – monitoring trends overtime. • Store data and meta data – need the ability to “freeze” and store data for analysis such as forest plan revision • Integrate with other NFS applications – GI tool, FACTS, (QA Analyst??) etc • Document Process – user’s guides, tech transfer
Mark Twain National Forest The Mark Twain started intensification of the FIA plots in 1976 for the Forest plan (2x). State completed 2x intensification for 1989 periodic inventory. Stayed with 2x intensification when FIA changed to annual inventory in 1999. MT continued 2x in 2001. Started 7x intensification for Phase 3 plots on MT in 2007. Annual cost of $65,000 to the Forest since 2001. FIA is ourStrategic Inventory
Mark Twain FIA Inventory 483 Phase 2 plots (2 x Intensification) 110 Phase 3 Plots (7 x Intensification)
Forest Planning, Inventory & Monitoring need to address: What vegetation data will be used to describe the “Desired Condition”? Put NF Lands into “Context” of the Landscape – Private and other lands. How reliable will the estimates be? Can we answer “What has changed?” and “By how much?” “Are we moving towards the Desired Condition? By how much?”
How are we using FIA data? • Forest Plan uses FIA as Primary Inventory Data for yield table analysis and current condition. • Forest Plan EIS uses FIA data for Cumulative Effects Analysis. • Working on how to use FIA data for • Vegetation Map Unit descriptions • Project level cumulative effects • Forest Plan Monitoring
Using FIA data to Describe LTAs Plot Selection Data Selection Time 1 Compare & Trend Analysis Report Output Time 2
Forest Health use of FIA and Forest Parameter datasets http://www.fs.fed.us/foresthealth/technology/nidrm_spb.shtml