Download
1 / 25
250 likes | 328 Vues
Energy-saving opportunities in Pumping Systems:. Where they are and how to recognize them. MAM-001aR1. Big Picture Perspectives: Industrial Motor Systems. Industrial motor systems: - are the single largest electrical end use category in the American economy

E N D
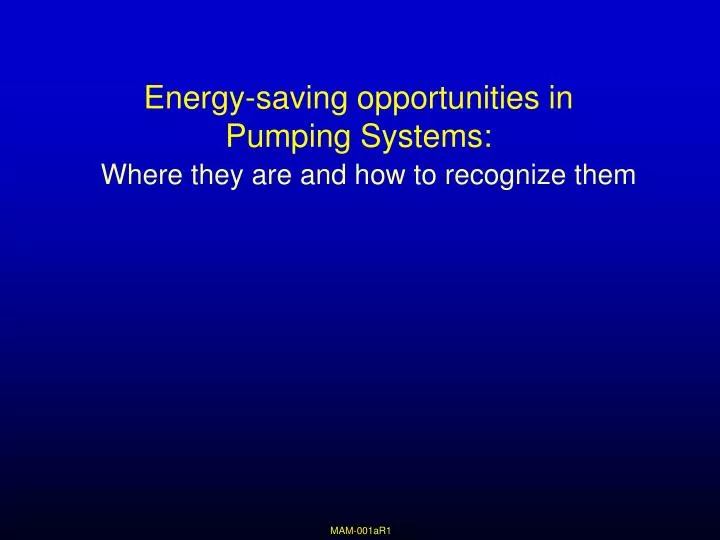
Energy-saving opportunities inPumping Systems: Where they are and how to recognize them MAM-001aR1
Big Picture Perspectives: Industrial Motor Systems Industrial motor systems: - are the single largest electrical end use category in the American economy - account for 25% of U.S. electrical sales
Motor loads dominate industrial electrical energy consumption Lighting & Other Process Heating Electrolytics Motor-Driven Equipment
Over 60% of industrial motor-system energy consumption involves fluid handling Just over 1/3 of the motor population accounts for almost 2/3 of the energy Other 4.3% Pumps 24.8% Material processing 22.5% Material handling 12.2% Fans 13.7% Refrigeration 6.7% Compressed Air 15.8% A large portion are centrifugal devices
A small fraction of the motor population is responsible for most of the energy consumption Energy 100 90 80 70 60 10% population uses 80% energy 50 Percent of energy/population 40 30 Population 20 10 0 > 5 > 1 > 50 > 20 > 500 > 200 > 100 > 1000 Cumulative motor horsepower range Note the descending order (left to right)
Comparing life cycle costs: automobile and pump/motor combination Common assumptions Discount rate = 8% Non-energy inflation rate = 4% Lifetime = 10 years Item Automobile Pump & motor Initial energy cost rate $1.50/gal 5 cents/kWhr Energy inflation rate 10%/yr 5%/yr Operating extent 12,500 miles/yr 7000 hr/yr (80%)
Life cycle cost - example automobileFull size vehicle, $28,000 price tag, 24 mpg Miscellaneous 2% Energy 16% Purchase: 51% Maintenance, Insurance 31%
Life cycle cost - 250-hp pump and motor$28,000 initial cost, 95% motor efficiency Miscellaneous Purchase operations 3% 2% Maintenance, downtime 21% First year energy cost = $69,000 First year energy cost = $69,000 First year energy cost = $69,000 Energy 74%
Higher first cost pump and motor ($56K),low service time (2,000 hrs/year) Miscellaneous operations 6% Purchase 20% Maintenance 15% Energy First year energy cost = $19,600 First year energy cost = $19,600 First year energy cost = $19,600 59%
Pump and motor component efficiencies:Seventy+ years of progress Pump Motor Year efficiency (%) efficiency(%) 1928 80 87.5 1955 85 90.5 2002 88 95.4 Achievable efficiency estimates for commercially available 75-hp pump and motor
What can you deduce about thesurroundings from this picture?
With pumpingsystems, motor and pump performance is just part of the bigger picture
The Pareto Principle or "the vital few and trivial many" J. M. Juran, who first used the term "Pareto Principle" also coined a more descriptive phrase: "The VITAL FEW and the trivial many" (Relatively few are responsible for relatively much) Input Output 80% 20% 80% 20%
Prescreening to narrow the field of focus - i.e., to select the VITAL FEW for further review Big loads that run a lot Big centrifugal loads that run a lot Filter 1 Filter 2 Symptom or experienced-based segregation Seldom used, small loads Large non- centrifugal loads * * Moderate priority Highest Priority * Productivity/reliability-critical systems sent to higher priority levels All plant motor systems Policies and practices bin
Example symptoms in pumping systems that indicate potential opportunity • Look for: • Throttle valve-controlled systems • Bypass (recirculation) line normally open • Multiple parallel pump system with same number of pumps always operating • Constant pump operation in a batch environment or frequent cycle batch operation in a continuous process • Cavitation noise (at pump or elsewhere in the system) • High system maintenance • Systems that have undergone change in function
Many life cycle elements influence reliability, cost, and productivity of motor-driven systems • Design • Procurement • Construction/Installation • Testing/Troubleshooting • Operation • Maintenance • Insurance • Regulations • Decommissioning • Down time • etc…. .
Most of these elements are interdependent Design Procurement Construction/Installation Testing/Troubleshooting Operation Maintenance Insurance Regulations Decommissioning Down time Example: other factors do or may affect maintenance Affect Maintenance
Just like any stable control system, optimal asset management requires feedback Design Procurement Construction/Installation Testing/Troubleshooting Operation Maintenance Insurance Regulations Decommissioning Maintenance does, should or may affect Down time Unfortunately, feedback is often weak or non-existent
Life cycle elements are an integrated system, much like the physical systems themselves • The elements can be treated as components • For example, procurement can be on lowest first cost basis, without regard to the effect on maintenance or operations • The elements can be treated as a system • For example, procurement considers all the elements of cost and is based on lowest total life cycle cost
Ideally, all the life cycle elements could be analyzed with a single common denominator • Design • Procurement • Construction/Installation • Testing/Troubleshooting • Operation • Maintenance • Insurance • Regulations • Decommissioning • Down time • etc…. Cost
When considering options, some elements can often be disregarded - even at the system level • Insurance • Regulations • Decommissioning
Alternatives & supplements to life cycle cost analysis • Probabilistic analysis of reliability & risk (commercial software is available) • Engineering judgment • Weighted/graded evaluation • Sole-source contracting (initial selection would involve overall cost/reliability considerations) • Outsourcing - shed some of the decision-making responsibility
Contingency planning - making the change when a failure occurs • The alternatives evaluation picture changes dramatically when failures occur • Changes that couldn't be justified when the system was functional may very well be after failure • The alternative may actually be less costly than simple repair/replace of the existing component