Download
1 / 26
430 likes | 887 Vues
C HASE A QUILANO J ACOBS. Operations Management. For Competitive Advantage. Chapter 9. Strategic Capacity Management. ninth edition. Chapter 9 Strategic Capacity Planning. Strategic Capacity Planning Defined Capacity Utilization & Best Operating Level

E N D
CHASE AQUILANO JACOBS Operations Management For Competitive Advantage Chapter 9 Strategic Capacity Management ninth edition
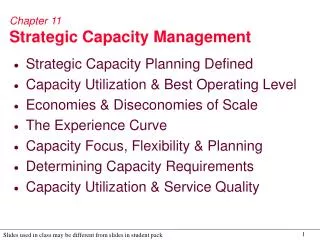
Chapter 9Strategic Capacity Planning • Strategic Capacity Planning Defined • Capacity Utilization & Best Operating Level • Economies & Diseconomies of Scale • The Experience Curve • Capacity Focus, Flexibility & Planning • Determining Capacity Requirements • Decision Trees • Capacity Utilization & Service Quality
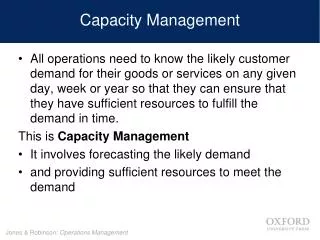
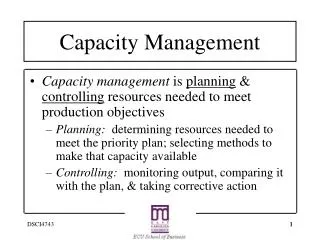
Strategic Capacity PlanningDefined • Capacity can be defined as the ability to hold, receive, store, or accommodate. • Strategic capacity planning is an approach for determining the overall capacity level of capital intensive resources, including facilities, equipment, and overall labor force size.
Capacity Utilization • Capacity used • rate of output actually achieved • Best operating level • capacity for which the process was designed • Capacity utilization rate = Capacity used • Best operating level
Best Operating Level Best Operating Level Average unit cost of output Underutilization Overutilization Volume
Example of Capacity Utilization • During one week of production, a plant produced 83 units of a product. Its historic highest or best utilization recorded was 120 units per week. What is this plant’s capacity utilization rate? • Answer: Capacity utilization rate = Capacity used . Best operating level = 83/120 =0.69 or 69%
100-unit plant 200-unit plant 400-unit plant 300-unit plant Economies & Diseconomies of Scale Economies of Scale and the Experience Curve working Average unit cost of output Diseconomies of Scale start working Volume
The Experience Curve As plants produce more products, they gain experience in the best production methods and reduce their costs per unit. Cost or price per unit Total accumulated production of units
Capacity Focus • The concept of the focused factory holds that production facilities work best when they focus on a fairly limited set of production objectives. • Plants Within Plants (PWP) (from Skinner) • Extend focus concept to operating level
Capacity Flexibility • Flexible plants • Flexible processes • Flexible workers
Stage 1 Stage 2 Stage 3 Capacity Planning: Balance • Maintaining System Balance Units per month 6,000 7,000 4,500
Capacity Planning • Frequency of Capacity Additions • External Sources of Capacity
Determining Capacity Requirements • Forecast sales within each individual product line. • Calculate equipment and labor requirements to meet the forecasts. • Project equipment and labor availability over the planning horizon.
Example of Capacity Requirements A manufacturer produces two lines of mustard, FancyFine and Generic line. Each is sold in small and family-size plastic bottles. The following table shows forecast demand for the next four years.
Example of Capacity Requirements: The Product from a Capacity Viewpoint • Question: Are we really producing two different types of mustards from the standpoint of capacity requirements? • Answer: No, it’s the same product just packaged differently.
Example of Capacity Requirements: Equipment and Labor Requirements Three 100,000 units-per-year machines are available for small-bottle production. Two operators required per machine. Two 120,000 units-per-year machines are available for family-sized-bottle production. Three operators required per machine.
17 Question: What are the Year 1 values for capacity, machine, and labor? 150,000/300,000=50% At 1 machine for 100,000, it takes 1.5 machines for 150,000 At 2 operators for 100,000, it takes 3 operators for 150,000 • The McGraw-Hill Companies, Inc., 2001
18 Question: What are the values for columns 2, 3 and 4 in the table below? 56.67% 1.70 3.40 66.67% 2.00 4.00 80.00% 2.40 4.80 58.33% 1.17 3.50 70.83% 1.42 4.25 83.33% 1.67 5.00 • The McGraw-Hill Companies, Inc., 2001
Example of a Decision Tree Problem A glass factory specializing in crystal is experiencing a substantial backlog, and the firm's management is considering three courses of action: A) Arrange for subcontracting, B) Construct new facilities. C) Do nothing (no change) The correct choice depends largely upon demand, which may be low, medium, or high. By consensus, management estimates the respective demand probabilities as .10, .50, and .40.
Example of a Decision Tree Problem: The Payoff Table The management also estimates the profits when choosing from the three alternatives (A, B, and C) under the differing probable levels of demand. These costs, in thousands of dollars are presented in the table below:
A B C Example of a Decision Tree Problem: Step 1. We start by drawing the three decisions
$90k High demand (.4) $50k Medium demand (.5) $10k Low demand (.1) A $200k High demand (.4) $25k B Medium demand (.5) -$120k Low demand (.1) C $60k High demand (.4) $40k Medium demand (.5) $20k Low demand (.1) Example of Decision Tree Problem: Step 2. Add our possible states of nature, probabilities, and payoffs
$90k High demand (.4) $50k Medium demand (.5) $62k $10k Low demand (.1) A EVA=.4(90)+.5(50)+.1(10)=$62k Example of Decision Tree Problem: Step 3. Determine the expected value of each decision
$90k High demand (.4) $50k Medium demand (.5) $10k Low demand (.1) A $200k High demand (.4) $25k B Medium demand (.5) -$120k Low demand (.1) C $60k High demand (.4) $40k Medium demand (.5) $20k Low demand (.1) Example of Decision Tree Problem: Step 4. Make decision $62k $80.5k $46k Alternative B generates the greatest expected profit, so our choice is B or to construct a new facility.
Planning Service Capacity • Time • Location • Volatility of Demand
Capacity Utilization & Service Quality • Best operating point is near 70% of capacity • From 70% to 100% of service capacity, what do you think happens to service quality?