Download

1 / 42
460 likes | 692 Vues
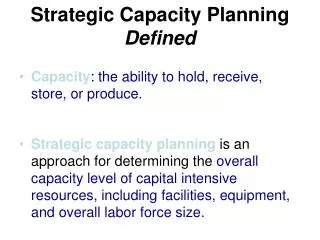
Strategic Capacity Management. Dr. Ron Tibben-Lembke Operations Management. Ideal Capacity of a Process. What is the capacity of the system? Should we add any capacity? How should we run the system? Where should we keep inventory?. 50/hr. 20/hr. 10/hr. 40/hr.

E N D
Strategic Capacity Management Dr. Ron Tibben-Lembke Operations Management
Ideal Capacity of a Process • What is the capacity of the system? • Should we add any capacity? • How should we run the system? • Where should we keep inventory? 50/hr 20/hr 10/hr 40/hr
Ideal Capacity of a Process • What is the capacity of the system? 6 min 4 min 5 min 5 min
Productivity • Productivity = Outputs / Inputs • Partial: Output/Labor or Output/Capital • Multifactor: Output / (Labor + Capital + Energy ) • Total Measure: Output / Inputs
Automotive Productivity • Book Data: • Jaguar: 14 cars/employee • Volvo: 29 cars/employee • Mini: 39 cars/employee
Improving Productivity • Develop productivity measurements– you can’t improve what you can’t measure • Identify and Improve bottleneck operations first • Establish goals, document and publicize improvements
U.S. Work and Productivity Source: International Labor Organization, 1999
What Would Henry Say? • Ford introduced the $5 (per day) wage in 1914 • He introduced the 40 hour work week • “so people would have more time to buy” • It also meant more output: 3*8 > 2*10 • “Now we know from our experience in changing from six to five days and back again that we can get at least as great production in five days as we can in six, and we shall probably get a greater, for the pressure will bring better methods. • Crowther, World’s Work, 1926
Forty Hour Week • Ernst Abbe, Karl Zeiss optics • 1896: as much done in 9 as in 8.
Marginal Output of Time • As you work more hours, your productivity per hour goes down • Eventually, it goes negative. Chapman, 1909
“Crunch Mode” • Ea_spouse: 12/04 • “Pre-crunch” • SO was working 7 * 13: 91 per week! • Maybe time off at 6pm Saturday • $5k signing bonus, couldn’t quit • Class action: April ‘06 $14.9m • Igda.org “Why Crunch Mode Doesn’t Work: 6 Lessons”
Learning Curves • time/unit goes down consistently • Down by 10% as output doubles • We can use Logarithms to approximate this • If you ever need this, email me, and we can talk as much as you want
Example 3.3 • Paul’s 1 2 3 4 5 • Bottles 60 100 150 200 250 • Bags 100 200 300 400 500 • Newman’s • Bottles 75 85 95 97 98 • Bags 200 400 600 650 680
Example 3.3 • Bottles 135 185 245 297 348 • Bags 300 600 900 1,050 1,180 • 3 bottle machines 150k each/yr = 450k • 5 bag machines, 250k each/yr = 1,250k
Example 3.3 • Bottles 135 185 245 297 348 • Machines 1 2 2 2 3 • Mach. usage 0.9 1.23 1.63 1.98 2.32 • Workers 1.8 2.46 3.27 3.96 4.64 • Bags 300 600 900 1,050 1,180 • Machines 2 3 4 5 5 • Mach Usage 1.2 2.4 3.6 4.2 4.7 • Workers 3.6 7.2 10.8 12.6 14.1
Capacity Tradeoffs • Can we make combinations in between? 120,000 4-door cars 150,000 Two-door cars
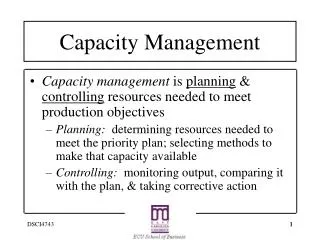
How much do we have? • We can only sustain so much effort. • “Best Operating Level” • Output level process designed for • Lowest cost per unit • Capacity utilization = capacity used best operating level • Hard to run > 1.0 for long
Time Horizons • Long-Range: over a year – acquiring, disposing of production resources • Intermediate Range: Monthly or quarterly plans, hiring, firing, layoffs • Short Range – less than a month, daily or weekly scheduling process, overtime, worker scheduling, etc.
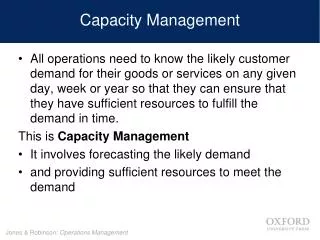
Service Differences • Arrival Rate very variable • Can’t store the products - yesterday’s flight? • Service times variable • Serve me “Right Now!” • Rates change quickly • Schedule capacity in 10 minute intervals, not months • How much capacity do we need?
Capacity Levels in Service =100% Zone of non-service < =70% Mean arrival rate, Critical Zone Zone of service Mean service rate,
Adding Capacity • Expensive to add capacity • A few large expansions are cheaper (per unit) than many small additions • Large expansions allow of “clean sheet of paper” thinking, re-design of processes • Carry unused overhead for a long time • May never be needed • Small expansions may “pave the cow path”
Capacity Planning • How much capacity should we add? • Conservative Optimistic • Forecast possible demand scenarios (Chapter 10) • Determine capacity needed for likely levels • Determine “capacity cushion” desired
Reengineering • “Business Process Reengineering” (Hammer and Champy) • Companies grow over time, adding plants, lines, facilities, etc. • Growth may not end in optimal form • Re-design processes from ground up
Capacity Sources • In addition to expanding facilities: • Two or three shifts • Outsourcing non-core activities • Training or acquisition of faster equipment
Decision Trees • Consider different possible decisions, and different possible outcomes • Compute expected profits of each decision • Choose decision with highest expected profits, work your way back up the tree.
Decision Trees Example 3.4, p.65 • Computer store thinks demand may grow. • Expansion costs $87k, new site $210k, and would cost same if wait a year • New site: • 55% chance of profits of $195k. • 45% chance of $115k profits. • Expand Current • 55% chance of $190k profits • 45% chance of $100k profits • Wait and see- enlarge store next year if demand grows • If high demand, $190k with expanded store • If high demand, $170 with current store • If weak demand, $105k with current store • Find the expected profits over 5 years, choose best one.
Decision Trees • Decision point • Chance events • Outcomes • Calculate expected value of each chance event, starting at far right • Working our way back toward the beginning, choosing highest expected outcome at each decision
Rev – Expand Cost Revenue - Move Cost Revenue - Move Cost Revenue – Expand Cost Revenue – Expand Cost Rev - Expand Cost Revenue Decision Trees Strong Growth Move 0.55 Weak Growth 0.45 Strong Growth 0.55 Hackers’ Computer Store Expand Weak Growth 0.45 Expand Wait and See Strong Growth Do nothing 0.55 Weak Growth 0.45
Possible 5 year Revenues • New, growth: 195*5 – 210 = 765 • New, low: 115*5 – 210 = 365 • Expand, growth: 190*5 – 87 = 863 • Expand, low: 100*5 – 87 = 413 • Wait, strong, expand: 170+190*4-87=843 • Wait, strong, do nothing: 170*5 = 850 • Wait, low, do nothing: 105*5 = 525
843 765 365 863 413 850 525 Decision Trees Strong Growth Move 0.55 Weak Growth 0.45 Strong Growth 0.55 Hackers’ Computer Store Expand Weak Growth 0.45 Expand Wait and See Strong Growth Do nothing 0.55 Weak Growth 0.45
Making the Decision • Starting at the far right, look at the “Wait and See” option. If demand is strong, we would obviously not expand. • $850k is better than $843. • Eliminate the “Expand option”
843 765 365 863 413 850 525 Decision Trees Strong Growth Move 0.55 Weak Growth 0.45 Strong Growth 0.55 Hackers’ Computer Store Expand Weak Growth 0.45 Expand Wait and See Strong Growth Do nothing 0.55 Weak Growth 0.45
Expected Values • Move: • 0.55* 765 + 0.45*365 = $585,000 • Wait and See: • 0.55*850 + 0.45*525 = $703,750 • Expand: • 0.55 * 863 + 0.45 * 413 = $660,500 • Highest expected value is to Wait and see, and either way, do nothing!
765 365 863 413 850 843 525 Decision Trees $585,000 Strong Growth Move 0.55 Weak Growth 0.45 660,500 Strong Growth 0.55 Hackers’ Computer Store Expand Weak Growth 0.45 Expand 703,750 Wait and See Strong Growth Do nothing 0.55 Weak Growth 0.45
Other considerations • Another criteria to use is to pick the one with the highest down side. • Under this, do nothing still wins. • We could also consider the expected value of the future cash streams. • PV = $100/(1+r) = $100/(1.16)=$86.27
Present Values - p.377 • At 16%, Next year is worth 0.862 • =(1+rate)^(-years) • Year 2: 0.743 • Year 3: 0.641 • Year 4: 0.552 • Year 5: 0.476 • 195 per year for 5 years: 195 * (3.274)
428,487 166,544 535,116 240,429 556,630 529,874 343,801 Decision Tree-NPV $310,613 Strong Growth Move 0.55 Weak Growth 0.45 402,507 Strong Growth 0.55 Hackers’ Computer Store Expand Weak Growth 0.45 Expand 460,857 Wait and See Strong Growth Do nothing 0.55 Weak Growth 0.45
Real Options • Assess the value to me of being able to change my mind in the future • Changed problem slightly - • Reduced benefit doing nothing, high demand
843 820 525 820 525 863 365 765 413 Decision Trees 0.25 Strong $465,000 Move 0.75 Weak Hackers’ Computer Store 0.25 Strong 533,000 Expand Weak 0.75 Expand 604,500 0.25 Strong Wait and See Do nothing Weak 0.75 598,750 0.25 Strong Do Nothing Weak 0.75
Real Options • If we didn’t have the wait and see option, we would Do Nothing. • Option to wait and see is worth $5,750 604,500 Wait and See $5,750 598,750 Do Nothing 533,000 Expand 465,000 Move