Download
1 / 16
160 likes | 264 Vues
Explore statistical methods to identify factors affecting patient satisfaction levels in a healthcare setting. Analyze data, correlation, and significance to improve overall satisfaction rates.

E N D
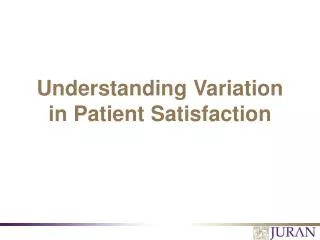
Variation in Patient Satisfaction Associated With Nursing Step 1 - Define the Practical Problem Step 2 -Translate to a Statistical Problem Step 3 - Solve the Statistical Problem Step 4 - Translate back to the Practical Problem Y = f(X) Patient Satisfaction associated with Nursing = f(??????) Purpose: To use appropriate graphical and statistical techniques to identify and quantify the critical factors associated with the variation in overall patient satisfaction. Understanding Variation in Patient Satisfaction 2 .PPT
Step 1: Define the Practical Problem • The hospital has made significant improvements in patient satisfaction over the past few years, but achieving the system goal of 85% excellent ratings has been difficult to achieve and maintain. • Anecdotal evidence abounds concerning reasons for variation in scores, but will these anecdotes be supported by the data? Understanding Variation in Patient Satisfaction 3 .PPT
Step 2: Translate to a Statistical Problem • Y – Overall Patient Satisfaction with Nursing • Is a function of: X1 – Agency Usage X2 – Overtime Usage X3 – Nursing Management Changes X4 – RN Turnover Rate X5 – Staffing Hours Variance X6 – Skill Mix Percentage X7 – Associate Satisfaction RN Y=f(x) Understanding Variation in Patient Satisfaction 4 .PPT
Step 3: Solve the Statistical Problem First, look at aggregate data for 2004: Patient Satisfaction with Nursing Descriptive Statistics Variable: Pt Sat Anderson-Darling Normality Test A-Squared: 0.512 P-Value: 0.185 Mean 0.786605 StDev 0.052595 Variance 2.77E-03 Skewness -7.7E-01 Kurtosis 0.383749 N 43 0.65 0.69 0.73 0.77 0.81 0.85 Minimum 0.645000 1st Quartile 0.759000 Median 0.787000 3rd Quartile 0.827000 Maximum 0.870000 95% Confidence Interval for Mu 95% Confidence Interval for Mu 0.770418 0.802791 0.768 0.778 0.788 0.798 0.808 0.818 95% Confidence Interval for Sigma 0.043367 0.066849 95% Confidence Interval for Median 95% Confidence Interval for Median 0.773366 0.813317 Understanding Variation in Patient Satisfaction 5 .PPT
Step 3: Solve the Statistical Problem (continued) I Chart for Pt Sat 0.95 UCL=0.9391 0.90 e u 0.85 l a V l 0.80 a Mean=0.7866 u d i 0.75 v i d n I 0.70 0.65 LCL=0.6341 0.60 0 10 20 30 40 Observation Number Overall Satisfaction Scores are in statistical control—however, this is not surprising since aggregated data is being used—it hides the true amount of variation. Understanding Variation in Patient Satisfaction 6 .PPT
Step 3: Solve the Statistical Problem (continued) 2004 Overall Agency Usage % by Nursing Unit Descriptive Statistics Variable: Agency Anderson-Darling Normality Test A-Squared: 1.279 P-Value: 0.002 Mean 4.44E-02 StDev 4.26E-02 Variance 1.81E-03 Skewness 0.971670 Kurtosis 0.384133 N 43 0.00 0.04 0.08 0.12 0.16 Minimum 0.000000 1st Quartile 0.005000 Median 0.035000 3rd Quartile 0.069000 Maximum 0.159000 95% Confidence Interval for Mu 95% Confidence Interval for Mu 0.031318 0.057520 0.02 0.03 0.04 0.05 0.06 95% Confidence Interval for Sigma 0.035100 0.054106 95% Confidence Interval for Median 95% Confidence Interval for Median 0.021683 0.054634 Understanding Variation in Patient Satisfaction 7 .PPT
Step 3: Solve the Statistical Problem (continued) I Chart for Agency 0.2 1 UCL=0.1571 e u l 0.1 a V l a u Mean=0.04442 d i v i d 0.0 n I LCL=-0.06830 -0.1 0 10 20 30 40 Observation Number Overall Agency Usage has one unit (7B at University) which falls outside the Upper Control Limit—however, 1 out of 43 units being out of control is no cause for alarm. Understanding Variation in Patient Satisfaction 8 .PPT
Step 3: Solve the Statistical Problem (continued) Correlation between Satisfaction Scores (Y) and Agency Usage (X1) Regression Plot P value =0.011 therefore it can be concluded with > 95% confidence that a statistically significant correlation exists. In fact, 14.6% of the variation in Pt. Sat. is explained by variation in Agency Usage. Pt Sat = 0.807609 - 0.472877 Agency S = 0.0491794 R-Sq = 14.6 % R-Sq(adj) = 12.6 % 0.85 t a S t 0.75 P Regression 95% CI 0.65 0.00 0.05 0.10 0.15 Agency Understanding Variation in Patient Satisfaction 9 .PPT
Step 3: Solve the Statistical Problem (continued) The following variables did not have a statistically significant correlation to Patient Satisfaction scores using 2004 aggregate data: • X2 – Overtime p-value = 0.121 • X6 – Skill mix p-value = 0.216 • X7 – AFS RN p-value = 0.879 Understanding Variation in Patient Satisfaction 10 .PPT
Step 3: Solve the Statistical Problem (continued) 2004 Monthly Satisfaction Scores by Nursing Unit Boxplots of Service by C2 (means are indicated by solid circles) 1.0 e 0.9 c n e l l 0.8 e c x E 0.7 e c i v r e 0.6 S 0.5 0.4 h F J h A A B S A B C A B C A B A B D U E S D U B U s s s d d W W W H C2 s s D T t t r N 5 5 5 a 6 6 6 7 7 7 a 8 8 9 9 a 2 n 3 S C C E B O 5 a a 4 4 W C 5 6 7 3 E G 2 S m m m F V S m m T - - E 4 & F B o o o C M o o h h 2 h L h h T T T T T 2 6 8 1 3 1 1 Understanding Variation in Patient Satisfaction 11 .PPT
Step 3: Solve the Statistical Problem (continued) Histogram of Monthly Variation in Satisfaction Scores Process Capability for Service Excellence Conclusion: 72% of the time nursing units fail to meet the 85% satisfaction goal Understanding Variation in Patient Satisfaction 12 .PPT
Conclusion:Nursing Units that use 5% Agency or less have a statistically significantly higher average satisfaction score than units that use greater than 5% agency. Step 3: Solve the Statistical Problem (continued) One-way ANOVA: Service Excellence versus Agency Usage < 5% Analysis of Variance for Service Source DF SS MS F P Agency U 1 0.17457 0.17457 21.88 0.000 Error 481 3.83771 0.00798 Total 482 4.01227 Individual 95% CIs For Mean Based on Pooled StDev Level N Mean StDev ------+---------+---------+---------+ n 164 0.76183 0.09767 (------*------) y 319 0.80197 0.08472 (----*----) ------+---------+---------+---------+ Pooled StDev = 0.08932 0.760 0.780 0.800 0.820 Understanding Variation in Patient Satisfaction 13 .PPT
Step 3: Solve the Statistical Problem (continued) • Result of Correlation/Regression • using monthly data for 2004 X1 – Agency Usage p value = 0.000 X2 – Overtime Usage p value = 0.000 X3 – Nursing Management Changes X4 – RN Turnover Rate p value = 0.545 X5 – Staffing Hours Variance p value = 0.117 X6 – Skill Mix Percentage p value = 0.006 Conclusion: P values less than 0.05 are statistically significant to a > than 95% Confidence Level. However, while statistically significant these variable explain only a small fraction of the variation in Patient Satisfaction. Understanding Variation in Patient Satisfaction 14 .PPT
Step 3: Solve the Statistical Problem (continued) Best Subsets Regression: Service Excellence versus Agency, OT, ... S D H k e P A i p P g l a D e l r n t V c O M a Vars R-Sq R-Sq(adj) y T i R r 1 3.8 3.6 X 1 3.1 2.9 X 2 5.6 5.2 X X 2 4.3 3.9 X X 3 6.3 5.7 X X X 3 6.1 5.5 X X X 4 6.9 6.1 X X X X 4 6.7 6.0 X X X X 5 7.3 6.3 X X X X X The regression equation is Service Excellence = 0.801 - 0.241 Agency - 0.583 OT + 0.0380 Skill Mix + 0.145 Depart Rate RN_1 - 0.00210 HPPD Predictor Coef SE Coef T P Constant 0.80123 0.01828 43.84 0.000 Agency -0.24136 0.08420 -2.87 0.004 OT -0.5833 0.1638 -3.56 0.000 Skill Mi 0.03800 0.02600 1.46 0.145 Depart R 0.14461 0.08675 1.67 0.096 HPPD -0.002103 0.001086 -1.94 0.053 S = 0.08831 R-Sq = 7.3% R-Sq(adj) = 6.3% Conclusion: Putting all the Factors (X’s) into the model only explains 7.3% of the total variation in satisfaction Understanding Variation in Patient Satisfaction 15 .PPT
Step 4: Translate Back to the Practical Problem What actions, if any, do you take knowing this information? Understanding Variation in Patient Satisfaction 16 .PPT