Download
1 / 17
170 likes | 250 Vues
Adding Richness to Measurement. A Case for Developing and Using Complex Measures. Data is Not Information The Search for Meaning in Measures. Meaning and Methodology - the Medium is the Message Multiple Users/Stakeholders Reporting Versus Quantitative Analysis Measuring Complex Outcomes

E N D
Adding Richness to Measurement A Case for Developing and Using Complex Measures
Data is Not InformationThe Search for Meaning in Measures • Meaning and Methodology - the Medium is the Message • Multiple Users/Stakeholders • Reporting Versus Quantitative Analysis • Measuring Complex Outcomes • Enterprise-Level Activities
Complexity - Multiple Stakeholders • The Public • Other Agencies - Entities • Budgeting • Program Funding Outcomes • Policy Decision Outcomes • Evaluating Agency - Vendor Performance
Complex Outcomes • Multiple Players (in a Stovepipe System) – Enterprise Level Activities • Significant Number/Scope of Independent Variables (Limited Control & Influence over Many Primary Outcomes) • Non-linear Processes (starts, stops, shifts, drops, etc.) • Hypothetical Nature of Many Public Sector Activities
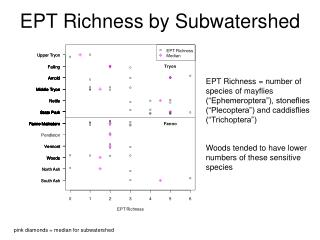
What does a typical KPM data chart really communicate? • Standard format is a column chart with a target Line overlay • Expressions are most often a yearly raw Mean • The format often implies variation in “performance” when differences are just normal process variation
And … in case you think I am making this up … real data from a real agency
And you find out things about your process you didn’t know before …
Aggregate Measures – Selling Points • Primary expression is a single expression “dashboard” indicator (Easy to understand – Easy to track) • Statistically based (mathematically verifiable – easy to audit) – immediately useful for process improvement purposes • Properly constructed indexes can be “de-aggregated” to provide increasingly granular detail back to the original raw datasets • Can combine different types of data into the same measure
Aggregate Measures – Selling Points • Provides a powerful analytic – process improvement tool • Provides more complete, compelling and valid data for budget support • Organizations can use a combination of related operational measures to create a single outcome index (fewer measures, and little need for multiple part measures in the system)Common Indices (Organizational Health, Timeliness of Process, Process Improvement, Customer Service, etc.) • Allows for updating and adjusting measure components without the need for a formal delete/replace (?)
Constructing Aggregate Measures • What is the Outcome? • What are the Primary Components of the Outcome? • What are the Critical Measures of the Components? • Normalizing Data – (removing outliers and translating data into a common unit of expression) • Weighting Components
Outcomes in the Public Sector • Change in Status • Change in Capability • Client/Customer Satisfaction • Process Outcomes – Efficiency/Effectiveness 1. Timeliness 2. Defects (errors, rework) 3. Cost Reduction (savings, avoidance) • DEFINED Outcomes
Normalizing Data • Distribution AnalysisData “shape” (distribution)Removing “outliers” – Special Causes of Variation = (Mean +/- 2 Standard Deviations) Upward and Downward Process Control Limits Baseline-ing • Combining Unlike Data Converting to a common expression - % of target
Weighting Criteria • Contribution to Outcome (High, Moderate, Low) • Criticality (Death, Dismemberment, Skin Rash) • Frequency (Constantly, Sometimes, Rarely) • Data Reliability (.99999, OK, Flip a Coin)
Examples • BOLI (Bureau of Labor and Industries) Composite Timeliness Measure (Wage and Hour, Civil Rights) • Department of Revenue “Taxpayer Assistance” • DHS-Courts-CCF Shared “Permanency of Placement”
Putting it all Together “Effective Discovery – Disclosure of Legal Records” Example Index Components