Download
1 / 1
20 likes | 171 Vues
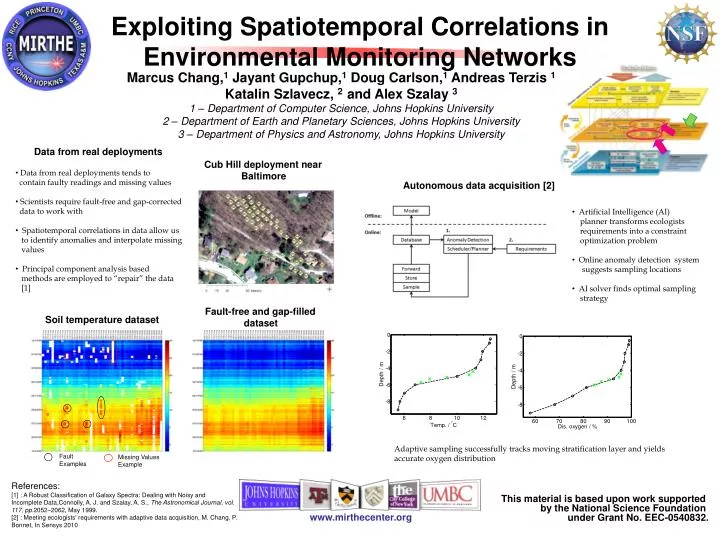
Exploiting Spatiotemporal Correlations in Environmental Monitoring Networks. Marcus Chang, 1 Jayant Gupchup, 1 Doug Carlson, 1 Andreas Terzis 1 Katalin Szlavecz, 2 and Alex Szalay 3 1 – Department of Computer Science, Johns Hopkins University

E N D
Exploiting Spatiotemporal Correlations in Environmental Monitoring Networks Marcus Chang,1 Jayant Gupchup,1 Doug Carlson,1 Andreas Terzis 1Katalin Szlavecz, 2and Alex Szalay 3 1 – Department of Computer Science, Johns Hopkins University 2 – Department of Earth and Planetary Sciences, Johns Hopkins University 3– Department of Physics and Astronomy, Johns Hopkins University Data from real deployments • Data from real deployments tends to • contain faulty readings and missing values • Scientists require fault-free and gap-corrected • data to work with • Spatiotemporal correlations in data allow us • to identify anomalies and interpolate missing • values • Principal component analysis based • methods are employed to “repair” the data • [1] Cub Hill deployment near Baltimore Autonomous data acquisition [2] • Artificial Intelligence (AI) • planner transforms ecologists • requirements into a constraint • optimization problem • Online anomaly detection system • suggests sampling locations • AI solver finds optimal sampling • strategy Fault-free and gap-filled dataset Soil temperature dataset Adaptive sampling successfully tracks moving stratification layer and yields accurate oxygen distribution Fault Examples Missing Values Example References: [1] : A Robust Classification of Galaxy Spectra: Dealing with Noisy and Incomplete Data,Connolly, A. J. and Szalay, A. S., The Astronomical Journal, vol. 117, pp.2052–2062, May 1999. [2] : Meeting ecologists' requirements with adaptive data acquisition, M. Chang, P. Bonnet, In Sensys 2010 This material is based upon work supported by the National Science Foundation under Grant No. EEC-0540832. www.mirthecenter.org