Download
1 / 18
180 likes | 318 Vues
Goals, Charts and dashboards. GCD - Agenda. Creating Goals What is a Goal Metric? Creating Charts Creating Dashboards Q & A. What are goals?. A ccessed by users, with the relevant security roles, from either the SALES or SERVICE areas on the CRM Site Map A measures of progress

E N D
GCD - Agenda • Creating Goals • What is a Goal Metric? • Creating Charts • Creating Dashboards • Q & A
What are goals? • Accessed by users, with the relevant security roles, from either the SALES or SERVICE areas on the CRM Site Map • A measures of progress • Enable managers to set sales, marketing or other business targets against employee results • Assigned to an individual or a team • Track important business data from both system and custom entities • Track results for a fiscal period or custom period • Goals recalculate every 24 hours (out of the box)
Key Terms • Targets – Objective of the Goal • Goal Metric – Type of Goal • Goal Owner – Who owns the Goal • Manager – Manager of the Goal (not the Owner) • Fiscal Period / Custom – What period is the Goal for • Parent Goal – Goal that this record rolls up to • Child Goals – Children records of this Goal • Rollup Query – Filter certain records to measure • Uses Advanced Find
Scenario • For 2013, Q4: • National Goal - $2,000,000 • West Region - $1,000,000 • Central Region - $500,000 • East Region - $500,000
Define a Goal metric • Two types of Goal Metrics • Amount • Count
Rollup Query Example • Define the data being measured:
Recalculate • Press the Recalculate button to see your progress
System Charts and dashboards vs. personal charts and dashboards • Who can see what?
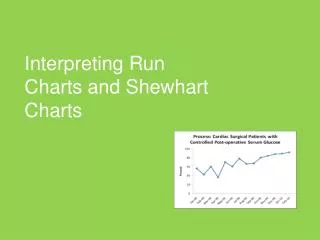
Create a sales pipeline chart • Charts can be created at both the system and user level • Personal charts can be created from the List View of the Entity
New Chart • Pick the Chart type • Select a field for your Legend • Select your Horizontal Axis • Save
New Dashboard • Workplace Dashboards • New • Select components to show in Dashboard