Download
1 / 34
360 likes | 603 Vues
Computer Assisted Photo-Interpretation. Basics of Photo-Interpretation Specificity of CAPI Sofware solutions in CAPI Features offered by CAPI. Photo-interpretation. Aerial photos. Aims. Mental exercise. Satellite images. Experts’ knowledge. Identify and extract thematic objets.

E N D
Computer Assisted Photo-Interpretation Basics of Photo-Interpretation Specificity of CAPI Sofware solutions in CAPI Features offered by CAPI
Photo-interpretation Aerial photos Aims Mental exercise Satellite images Experts’ knowledge Identify and extract thematic objets P. I. C.A.P.I. (classical) Results maps, statistical summaries, etc. Photo-Interpretation: General Scheme
PHOTOS OBSERVATION image 1 image 2 image 3 GROUND object 1 object 2 object 3 object 4 Type of photo, scale,atmospheric conditions, date... (texture, structures, shapes, morphology...) PHOTO ACQUISITION COUNTING MEASURES MAPPING Defining units, zones GROUND OBSERVATION INTERPRE- TATION Multiple iterations if necessary ANALYSIS AIMS According to Dizier / Léo Photo-interpretation: General Scheme
Aerial images Ground ... Colours Panchro. - true -false Domain of emulsions (panchromatic, tri-spectral, multispectral, etc.) a b c Satellite images d layer i layer 2 e f layer 1 Domain of geographic objects (nature, size, organisation...) Domain of radiometry (pixels, values, resolutions) From Ground to Images records
Domain of radiometry (pixels, values, resolutions...) From Ground to Images Photos Digital data ... Black & White chan. i chan. 2 chan. 1 Varied processing Monospectral, (grey levels) ... Colours - true - false trispectral, multispectral Result quality : f (type of support, resolutions, printing process…)
photo n° 1 photo n° 2 photo n° 3 Aerial Images Aerial shots - scheme
Photo-Interpretation – Classical Approach • General concepts et image elements to be considered • From images to ground information • Key elements for image interpretation • Steps in Photo-Interpretation • Synthetic view • Analytic view
From Images to Ground Information • Looking for and designing correlations between: • Analysing relations: • Grey levels • Colours and known real objects • Connexity • Contiguity • Communicability • Interdependance, etc. between geographic objects
From Images to Ground Information • Analogic approach: 1) From known and identified object • thematic method • confirmation and/or infirmation 2) From images specificities : • identify shapes and structures • bringing-in of new knowledge • Prerequisite of: • Thematic knowledge (experience) • Ground awareness
From Images to Ground Information • Results depending on interpreter’s abilities • Physical abilities • Psychic abilities • Synthesis skills • Other factors of importance for interpretation • Quality of photos and images • Shot scale • Data resolution
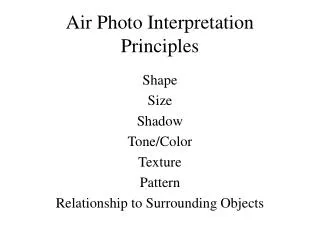
Image Elements to be Considered Colour - texture - structure • Intensity (Black & White images) • Panchromatique = easy interpretation • Infrared B & W = delicate interpretation • Colours (true and false) • True colours = easy interpretation • IR false colours = less easy interpretation (unusual vision)
Image Elements to be Considered 1- Main colour 2- Associate colour 3- Texture 4- Structure
Image Elements to be Considered Texcture of images: • Homogenous ensemble of elementary units (textural elements) • Size and shape (points, lines,..), density and combinations • Intensity and/or colours
Image Elements to be Considered Structure of images: • Spatial organisation of textural elements • Differenciations through shapes • Simplification for objects of same type • Relations between objects and surroundings • Graded phenomenon (depending on the level of observation and the scale) • Texture and structure = complex concepts
Photo-Interpretation – Classical Steps Analogic approach of images Two levels of approach not to be separated: 1- Synthetic view (global approach) 2- Analytic view (detailed approach)
Photo-Interpretation – Classical Steps Synthetic view of images • Global approach of satellite data and aerial photo mosaics • Aims: • Broad inventories, global organisations, regional phenomenon ... • Approach: • Defining homogenous areas • Method: • 4 steps defining those zones
Photo-Interpretation – Classical Steps 4 steps in defining homogenous zones 1- Global observation of the image (more or less distant) 1st identification of main elements 2- Careful observation of those elements Locating the spatial extension of those elements 3- Characterisation of the elements through: • shapes and size of the objects (photos) • design and arrangement of clours and shades (satellite images ) 4- Identifying contours: • locating maximal extension of zones • tracing zonal limits
Photo-Interpretation – Classical Steps Analytic viewing of images • Detailed approach of aerial photos and satellite images • Aims : identifying détails (for an item) • 4 successive steps-approach (same criteria as before) • Close 2 D observation - point and linear objects - theme by theme • 3D observation - links objects/topography/surroundings • Elaborating a first caption - uncertainty • Determining points to be visited and precised
Photo-Interpretation – Classical Steps • Limits of classical photo-interpretation: • Results are often rough (experience) • Tracing are not precise (interpretation tracing) • Calculating surfaces: not easy • Analytic approach ± limited with satellite images • Interest of a complementary approach beween photos, images and ground knowledge
Satellite image : objects are not directly identifiable, very good spatial vision • Digital processing Pixels • Photo • interpretation 3 channels Aerial photo : objetcs are more or less identifiables, Good vision of their distribution • INTERPRETATION Synthesis Ground surveys 20 m Own experience of the interpreter 20 m Ground survey :objects perfectly identified but not easily mapped Complementary Approaches
Why Computer Assisted Photo-Interpretation ? (1) CAPI contribution (vs classical PI): • Radiometric and geometric pre-processing • Calculation of neo-channels • Display ergonomy (zoom, scroll, multi-window, …) • Choice of channels and contrast enhancement can be adapted to different objects • Observed objects can be delimited through interactive, automatic or semi-automatic tools • …
Why Computer Assisted Photo-Interpretation ? (2) CAPI contribution (vs classical PI): • … • Updating existing geographic data • Combination of multi-source data better discrimination of studied objects • Availability of spatial analysis tools to enhance the interpretation • Automatic calculation of surfaces for each class or each object • Mapping and publishing tools
Computer Assisted Photo-Interpretation (CAPI) • Digital processing + visual analysis on computer • Different software for CAPI: • Specific CAPI software • Image processing software • GIS software
CAPI Specific Software • Specific backgrounds (military) / expensive • Efficiency (work rapidly / large volumes of data / great precision) • Ergonomy • Easy-to use • Main features: • Geographical conformity / heterogenuous data • Display: subsidiary slave windows • Automatic or semi-automatic detection of shapes and objects • Aided interpretation (expert systems)
Image Processing / GIS Software • Classical IP sofware more and more incorporate: • CAD functionalities • Crossing raster, vector and tabular data • Vector features (digitsing objects and drawing • GIS sofware: development of raster features (standard features or specific “modules”) • Capable of overlaying images with other data (vector layers) • Including CAD features more powerful than those found in IP software • Capable of directly storing IP results into the GIS database
Features offered by CAPI • Pre-processing and analysis of raw and derived images • Automatic & semi-automatic extraction of information • Overlaying of data • Other interpretation possibilities
Pre-processing & Analysis of Raw & Derived Images • Improvement of contrasts • Enhancing the clarity of images / not modifying the raw values • Possibility to redistribute values over specific parts of histograms / optimise interpretation • Radiometric analysis: • Correlation between radiometry and known objects • Establishment of reflectance properties of objects of interest • Creation of neo-channels • Vegetation index, brightness index, etc. • Decorrelated channels
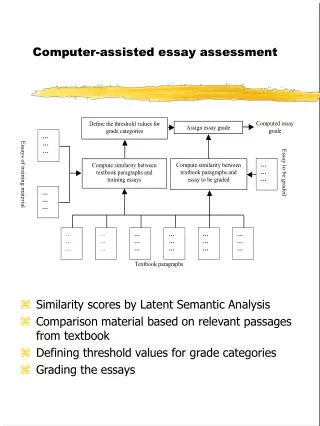
Automatic & semi-automatic Extraction of Information • Radiometric thresholding of channels Automatic extraction of information / quick evaluation of results Example: extracting water on XS3 SPOT (or Veg. Index) channel • Texture enhancement Adapted filters (local contrast, extracting shapes and objects) • Image classification Automatic classification VS Interactive methods • Extracting areas limits and linear elements • Calculation of surfaces Small geometric distorsions / reliable results
Overlaying of Data • Multidate data from the same source • Multi-date coloured composites • Different seasons • Interannual changes • Data at different resolutions • Different contributions • Improvement of objects identification and analysis Example: P+XS combination in SPOT data P: mineral element / XS: vegetation
Other Interpretation Possibilities • External data (DEM, DTM, basic maps, etc.) • Transparently overlaid data to be updated • Possibility of rendering DEMs and DTMs • Measuring distances and surfaces, calculation of areas and perimeters • Extracting limits and automatic retrieval of outlines and contours
CAPI - Examples • Multi-temporal colour composites • Image analysis with reference data • Post-classification comparisons
CAPI of Multi-temporal Colour Composites Combinating 3 layers from 2 images Landsat TM 1984 (2) 1991 (1) (http://www.ccrs.nrcan.gc.ca) A : Forest (dark green) B : Forest cut between 1984 and 1991 (light blue) C : Recently cut areas in 1984 (pink) D : Forest regeneration (light green or yellow)
Reference • Map • Classified image • (Image) Land use Image Analysis & Reference Data Image SPOT 27/07/2000 (coloured combination) Analysis • Under mask • Visual (CAPI) • Qualitative • Quantitative • Digital • Classification • Thresholding Masked image (vineyard)
CLASSIFICATION CAPI to from Change matrix Fields Forest Scrub Urban Fields 1 2 3 4 Forest 5 6 7 8 Scrub 9 10 11 12 Urban 13 14 15 16 Urban growth Detecting Changes Image SPOT XS april 2000 Image SPOT XS june 2000


![Computer Assisted Learning [CAL]](https://cdn2.slideserve.com/3962806/slide1-dt.jpg)