Download
1 / 16
160 likes | 292 Vues
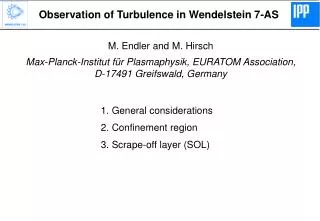
Equilibrium and Stability of High- b Plasmas in Wendelstein 7-AS. M.C. Zarnstorff 1 , A. Weller 2 , J. Geiger 2 , E. Fredrickson 1 , S. Hudson 1 , J.P. Knauer 2 , A. Reiman 1 , A. Dinklage 2 , G.-Y. Fu 1 , L.P. Ku 1 , D. Monticello 1 , A. Werner 2 , the W7-AS Team and NBI-Group.

E N D
Equilibrium and Stability of High-b Plasmas in Wendelstein 7-AS M.C. Zarnstorff1, A. Weller2, J. Geiger2, E. Fredrickson1, S. Hudson1, J.P. Knauer2, A. Reiman1, A. Dinklage2, G.-Y. Fu1, L.P. Ku1, D. Monticello1, A. Werner2, the W7-AS Team and NBI-Group. 1Princeton Plasma Physics Laboratory 2Max-Planck Institut für Plasmaphysik, Germany IAEA Fusion Energy Conference 2004 Vilamoura, Portugal 3 November 2004
Outline • b limits and sustainment in Wendelstein-7AS • Limiting mechanisms • Equilibrium & Stability properties • Conclusions
W7-AS – a flexible experiment 5 field periods, R = 2 m, minor radius a ≤ 0.16 m, B ≤ 2.5 T, vacuum rotational transform 0.25 ≤ iext ≤ 0.6 • Flexible coilset: • Modular coils produce helical field • TF coils, to control rotational transform i • Not shown: • divertor control coils • OH Transformer • Vertical field coils W7-AS Completed operation in 2002
b≈ 3.4 % : Quiescent, Quasi-stationary • B = 0.9 T, iotavac ≈0.5 • Almost quiescent high- b phase, MHD-activity in early medium-b phase • In general, b not limited by any detected MHD-activity. • IP = 0, but there can be local currents • Similar to High Density H-mode (HDH) • Similar b>3.4% plasmas achieved with B = 0.9 – 1.1 T with either NBI-alone, or combined NBI + OXB ECH heating. • Much higher than predicted b limit ~ 2% 54022
b> 3.2% maintained for > 100 tE • Peak <b> = 3.5% • High-b maintained as long as heating maintained, up to power handling limit of PFCs. • b-peak b-flat-top-avg • very stationary plasmas • No disruptions • Duration and b not limited by onset of observable MHD • What limits the observed b value?
Reconstructed Self-Consistent Equilibrium p iota 54022 • STELLOPT/VMEC design-optimization code adapted to be a free-boundary • equilibrium reconstruction code: fit p & j profiles to match measurements • Available data: • 45 point single-time Thompson scattering system • 19 magnetic measurements • Reconstructed equilibrium of b=3.4% plasma : lower central iota, flatter profile
b Sensitive to Equilibrium Characteristics <b> <b> Iota Variation Divertor Control Coil Variation 53052-55 • Achieved maximum b is sensitive to iota, control coil current, • vertical field, toroidal mirror depth. • At low iota, maximum b is close to classical equilibrium limit D ~ a/2 • Control coil excitation does not affect iota or ripple transport • Is b limited by an equilibrium limit?
Control Coil Variation Changes Flux Surface Topology ICC/IM = 0 b = 1.8% ICC/IM = 0.15 b = 2.0% VMEC boundary ICC/IM = 0.15 b = 2.7% • PIES equilibrium analysis using fixed • pressure profile from equilibrium fit • (not yet including current profile). • Calculation: at ~ fixed b, ICC/IM=0.15 • gives better flux surfaces • At experimental maximum b values • -- 1.8% for ICC/IM =0 • -- 2.7% for ICC/IM = 0.15 • calculate similar flux surface degradation
Degradation of Equilibrium May set b Limit • PIES equilibrium calculations • indicate that fraction of good • surfaces drops with b • Drop occurs at higher b for • higher ICC / IM • Experimental b value correlates • with loss of ~35% of minor • radius to stochastic fields or • islands • Loss of flux surfaces to islands • and stochastic regions should • degrade confinement. May be • mechanism causing variation • of b.
X-Ray Tomograms Pressure Driven Modes Observed, at Intermediateb • Dominant mode m/n = 2/1. • Modes disappear forb > 2.5% (due to inward shift of iota = ½?) • Reasonable agreement with CAS3D and Terpsichore linear stability calcs. Predicted threshold b < 1% • Does not inhibit access to higher b ! Linear stability threshold is not indicative of b limit.
<b> Low-mode Number MHD Is Very Sensitive to Edge Iota • Controlled iota scan, • varying ITF / IM, fixed B, PNB • Flattop phase • Strong MHD clearly degrades • confinement • Strong MHD activity only in • narrow ranges of external iota • Equilibrium fitting indicates • strong MHD occurs when • edge iota 0.5 or 0.6 • (m/n=2/1 or 5/3) • Strong MHD easily avoided • by ~4% change in TF current <b> Mirnov Ampl. (5-20kHz)
High-n Instabilities Observed in Special Situations I5 / IM = 1.4 • Typical high-b plasmas are calculated to be ballooning stable. No high-n instabilities are observed. • High-n instabilities are observed if Te drops below ~ 200eV. Probably a resistive instability. • W7AS can vary the toroidal ripple or mirror ratio using ‘corner coils’ (I5) • For I5 > IM, very unstable low-b phase, then spontaneous transition and rise to moderate b. • In later b > 2% phase, plasma calculated to be in ballooning 2nd stability regime. • How does it get there? dB=13.6% 56337
Access to 2nd Stability: Via Stable Path i Exp. b = 0.5% b = 1% b = 1.5% b = 2% b = 2.5% p p p p p • Local stability diagrams for infinite-n ballooning evaluated using technique • of Hudson and Hegna. Plots shown for r/a = 0.7 • For b> 2%, plasma is calculated to be in second regime for r/a < 0.8 • Thomson pressure profile measurement is only available for b= 1.6%. • Measured pressure profile shape was scaled up/down to evaluate • other b values. • 2nd stability to ballooning can be accessed on stable path, due to increase of shear with b and deformation of stability boundary.
Conclusions • Quasi-stationary, quiescent plasmas with b up to 3.5% produced in W7-AS for B = 0.9 – 1.1T, maintained for >100 tE • Maximum b-value appears to be controlled by changes in confinement, not MHD activity • No disruptions observed • No stability limit observed. Maximum b not limited by MHD activity. • Maximum b much higher than linear stability threshold. • Maximum b correlated with calculated loss of ~35% of minor radius to stochastic magnetic field. May limit b. • Pressure driven MHD activity is observed in some cases • Usually saturates at ~harmless level. Why? • Strong when edge iota 0.5 or 0.6 • Exists in narrow range of iota easily avoided by adjusting coil currents. • In increased mirror-ratio plasmas, calculations indicate second-stability for ballooning modes can be accessed via a stable path due to the evolution of the shear and stability boundary.
Magnetic Diagnostics are Sensitive to Current measured simulated measured Fit simulated 54022 • Small, but significant current inferred from equilibrium fit. • Estimated uncertainty of magnitude approx. 20% from Rogowski segments • Three moments used to fit current profile, • higher order moments used to force j(a)=0 • Fitted current is larger (in outer region) than model calculations of net current • from beam + bootstrap + compensating Ohmic currents.