Download
1 / 30
300 likes | 424 Vues
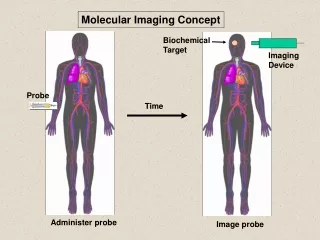
Probe Characterization. Amber Precision Instruments, Inc. (API). Our EMI Probes. EMI Probes: Up to 6 GHz Up to 20 GHz Up to 40 GHz. Optional EMI Probes; Choose: Size Frequency range Field Component. * EMI Hx 2 mm. Characterization Structure up to 15 GHz.

E N D
Probe Characterization Amber Precision Instruments, Inc. (API)
Our EMI Probes • EMI Probes: • Up to 6 GHz • Up to 20 GHz • Up to 40 GHz • Optional EMI Probes; • Choose: • Size • Frequency range • Field Component * EMI Hx 2 mm
Characterization Structureup to 15 GHz 50 Ohms Microstrip Line (MSL)
Characterization Structureup to 40 GHz 50 Ohms Air-Dielectric* Coplanar Waveguide (CPW) * To avoid the effect of non-TEM waves on probe characterization at higher freqs (>15 GHz).
Typical EMI Probe S21 * EMI Hx 2 mm: up to 10 GHz
What Are the Specs? Log freq: Low freq with 20 dB/dec slope * EMI Hx 2 mm
What Are the Specs? High freq: How high the probe measures? * EMI Hx 2 mm
What Are the Specs? Unwanted field: Decoupling of unwanted components * EMI Hx 2 mm
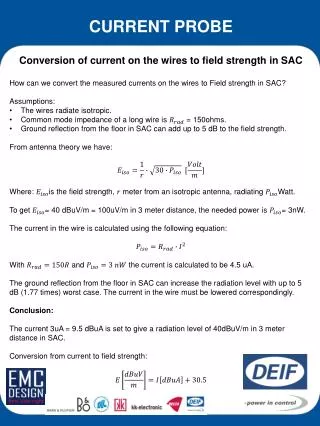
What Are the Specs? Low freq: How low the probe measures in a “practical” setup? 60 dB dynamic range 20 dB/dec slope 4 MHz
High Freq Probe * EMI Hx 1 mm L: up to 20 GHz
Probe Factor Probe factor: Provide probe factor SmartScan imports probe factor SmartScan measures and calculates system factor * EMI Hx 2 mm
Other Methods ofData Presentation • How other people characterize their probes? • How the characterization data is presented? • Is their data presentation fair?
Example* of 10 kHz (?) to 6 GHz Probe Data Presentation Let’s analyze the data! Extract * Aprel: http://media.wix.com/ugd/36d46a_46d2902bfdd24c25b401582e6a488370.pdf
Is Freq Scale OK? Let’s analyze the data! Why the freq axis of extracted data don’t match?! Let’s see!
Is Freq Scale OK? Why all ticks are equal?! Well, not a big deal. Maybe just a typo! 0.99999 GHz 1.3 GHz 1.3 GHz 1.3 GHz 1.1 GHz
Lower Frequencies Why all ticks are equal?! Well, not a big deal. Maybe just a typo! What happened to lower freqs?! What is the measurement instrument setup (IF BW, span, no. of points, etc.) to measure down to 10 kHz? Is it a “practical” setup? Is it extrapolated or really measured?
Plot It Differently What if we plot it in a different way (log freq)? The probe is NOT purely inductive at lower freqs (as claimed). Is it probe issue? Or, measurement issue? Or, simply not extrapolated the right way? Note: Simple extrapolation (even if it is done the right way) does NOT mean probe can measure down to that freq!
How about 10 kHz to20 GHz (?) Probe? Let’s analyze the data! Extract
Flat Response (?) Let’s analyze the data! The data is from -30 dB to -60 dB. Why the scale is from 0 to -180 dB?! Well, it looks better* this way! :-) *“flat response across the frequency range”
Plot It Differently What if we plot it in a different way (tight scale)?
Plot It Differently What if we plot it in a different way (log freq)? The lower freqs seems to be fine for this prob. The deviation might be just data extraction error.
Higher Frequencies How about the higher freqs? A deep notch is usually a BIG red flag for “unwanted field” coupling! There is about 20 dB notch @ 13 GHz!
Higher Frequencies The question is: Howto make sure this probe measures the “desired field” up to 20 GHz (as claimed)? The“unwanted field” decoupling data of probe need to be provided. This probe is suspected to work <10 GHz, unless the rejection info is available!
10 kHz to 40 GHz Probe Let’s analyze the data! Extract
Flat Response (?) Let’s analyze the data! Same question: The data is from -35 dB to -55 dB. Why the scale is from 0 to -120 dB?!
Plot It DifferentlySingle Probe Solution (?) What if we plot it in a different way (tight scale and log freq)? This info is NOT sufficient to evaluate the probe up to 40 GHz! What does happen to lower freqs? Does this probe have sufficient sensitivity to measure down to 10 kHz?! The “unwanted field” decoupling data of probe need to be provided.
Another Example* of Data Presentation Again, the data is from -30 dB to -60 dB. Why the scale is from 0 to -60 dB?! Without unwanted field data, there is no sufficient info to evaluate the probe. Log freq scale is required for low freq evaluation. * Detectus AB: http://www.detectus.se/products_nearfieldprobes.html
What to Look for inProbe Characterization Data? • Unwanted field rejection data need to be provided to determine higher usable freq. • Is lower usable freq achievable in a “practical” setup? • Is the probe purely inductive/capacitive at lower freqs? • Is the characterization structure (MSL, CPW, etc.) suitable for freq of interest? • What is the measurement setup/condition? • Is the scale proportional to data range?
Questions? Contact us: amberpi@amberpi.com www.amberpi.com