Download
1 / 76
760 likes | 872 Vues
On Capital Structure. The impact of debt financing on firm and project value. To borrow or not to borrow…?. Objective. To analyze the relationship between capital structure decision and firm value. Outline. The effect of financial leverage Measures of financial leverage

E N D
On Capital Structure The impact of debt financing on firm and project value
Objective To analyze the relationship between capital structure decision and firm value
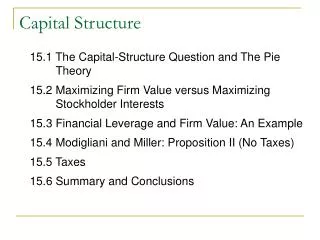
Outline • The effect of financial leverage • Measures of financial leverage • Capital structure and firm value • Empirical evidence on capital structure
The effect of financial leverage What do borrowing does to firm’s earnings?
Case A: The firm is all equity The firm has 400,000 shares outstanding, selling at $20/share
Case A: The firm is all equity The firm has 400,000 shares outstanding, selling at $20/share
Case A: The firm is all equity The firm has 400,000 shares outstanding, selling at $20/share
Case A: The firm is all equity The firm has 400,000 shares outstanding, selling at $20/share
Case A: The firm is all equity The firm has 400,000 shares outstanding, selling at $20/share
Case A: The firm is all equity The firm has 400,000 shares outstanding, selling at $20/share
Case B: The firm has $4 million in long-term debt @10%/year and 200,000 shares selling at $20/share.
Case B: The firm has $4 million in long-term debt @10%/year and 200,000 shares selling at $20/share.
Case B: The firm has $4 million in long-term debt @10%/year and 200,000 shares selling at $20/share.
Case B: The firm has $4 million in long-term debt @10%/year and 200,000 shares selling at $20/share.
Case B: The firm has $4 million in long-term debt @10%/year and 200,000 shares selling at $20/share.
Discussion The standard deviation of ROE and EPS has increased when compared to the no-debt case. Conclusion: With more debt, EPS and ROE become more volatile
Several measures of financial leverage • The debt-to-equity ratio • The total debt ratio • The dynamic degree of financial leverage • The static degree of financial leverage • Times interest earned • The cash coverage ratio
The debt-to-equity ratio D/E is the ratio of debt to equity. In case A, D/E = 0 In case B, D/E =1
The total debt ratio Total debt ratio = D/(D+E) D/(D+E) compares the value of debt to the total firm value In case A, D/(D+E) =0 In case B, D/(D+E) = 0.5
The dynamic degree of financial leverage (DDFL) measures the elasticity of EPS with respect to EBIT.DDFL= (%Chg. in EPS)/(%Chg. in EBIT) Consider the change in EBIT and EPS from the normal state to the booming state of the economy. In A, DDFL = 1 In B, DDFL = 1.67. Note: If you consider the change in EBIT and EPS from the booming state to the normal state of the economy the calculation yields a different ratio.
The static degree of financial leverage SDFL = EBIT/(EBIT - Interest) In A, SDFL =1 for all three states of the nature. In B, one has to use expected values SDFL = 1,000,000/600,000 = 1.67 Attention: SDFL is not always equal to DDFL. Each ratio captures a different aspect of the degree of financial leverage
Times interest earned TIE= EBIT/Interest TIE compares EBIT to the annual interest payment In B, TIE =2.5
The cash coverage ratio Cash coverage = (EBIT + Depreciation)/Interest Cash coverage compares EBIT plus depreciation to the annual interest payment. In B, cash coverage is no less than 2.5 (we don't know the annual amount of depreciation)
Measuring and evaluating leverage: A summary Debt makes cash flows more volatile. There are several ways to measure leverage. Each method offers a unique vantage point.
Leverage and optimal capital structure The static view Miller & Modigliani’s view
Leverage and optimal capital structure:The static view There is an optimal capital structure: That debt-to-equity ratio that maximizes total firm value.
The two opposite effects of leverage Risk increase (as discussed above) Discount rate becomes higher -> Total firm value goes down Tax savings Cash flows to stakeholders increase -> Total firm value goes up
Remember: Assets are financed by shareholders and creditors The cash flow from assets go back to shareholders and creditors The present value of cash flows from assets is the total market value of the firm, V: PV CF from assets = V At the same time, V = market value of equity + market value of debt Hence, PV CF from assets = market value of equity + market value of debt
Tax savings: Exemplification Cash flow from assets: Levered case = $50 + $30 =$80 Unlevered case = $60 By leveraging the project, we increase its total cash flows
Optimal capital structure:The static view A little debt will generates tax savings without adding too much risk A lot of debt will dramatically increase risk more than offsetting tax savings
V VU D/E Static view: Leverage and firm value
V VU D/E Static view: Leverage and firm value
V VU D/E Static view: Leverage and firm value
V VU D/E Static view: Leverage and firm value
V VU D/E Static view: Leverage and firm value
V VU D/E Static view: Leverage and firm value
V VU D/E Static view: Leverage and firm value
V VU D/E Static view: Leverage and firm value
V VU D/E Static view: Leverage and firm value
V VU D/E D/E* Static view: Leverage and firm value
The static view: A summary The optimal capital structure is simply a matter of balancing corporate debt tax shields against the risk of financial distress (bankruptcy costs)
The cost of bankruptcy The overall cost of bankruptcy is also called the cost of financial distress: direct (legal and administrative expenses) indirect (opportunity costs caused by the increasing difficulties of running a business on the brink of bankruptcy)
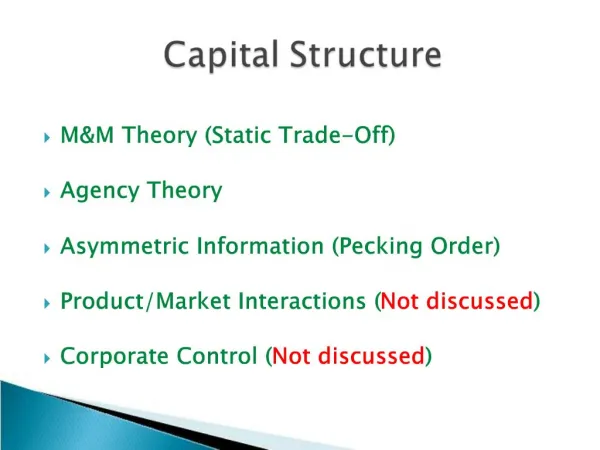
The theory of optimal capital structure (Merton Miller and Franco Modigliani) This theory is known as the irrelevance theory because M&M argue that capital structure doesn’t really matter
M&M 1958 I. The overall market value of the firm and the WACC are completely independent of firm's capital structure. II. The cost of equity is a linear function of firm's leverage