Download
1 / 7
70 likes | 177 Vues
Which cities produce more excellent papers than can be expected? . JASIST 2011 Lutz bornmann loet leydesdorff max planck society, hofgartenstr munich , Germany Amsterdam school of communications research, university of Amsterdam . Overview.

E N D
Which cities produce more excellent papers than can be expected? JASIST 2011 Lutz bornmann loetleydesdorff max planck society, hofgartenstrmunich, Germany Amsterdam school of communications research, university of Amsterdam
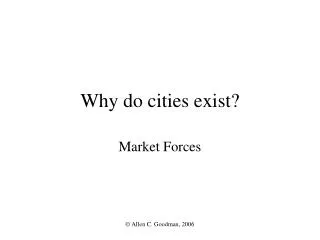
Overview We explore new methods to analyze the geographic distribution of highly-cited papers. This method is relatively straightforward identification of cities and regions with high output.
Method Focus on Top 10 in 2008 (Chemistry) Document type: Article Time span: All year CHEMISTRY, ANALYTICAL (1,227 articles) CHEMISTRY, APPLIED (870 articles) CHEMISTRY, INORGANIC & NUCLEAR (670 articles) CHEMISTRY, MEDICINAL (560 articles) CHEMISTRY, MULTIDISCIPLINARY (4,513 articles) CHEMISTRY, ORGANIC (1,349 articles) CHEMISTRY, PHYSICAL (2,418 articles)
Method Z test Pe = 0.1 P0 = n0/0 (n0= number of observed paper of this category) ne = n/10
Method z is positively :the observed number of top papers is larger than the expected number . Z is negatively: the observed number of top papers is smaller than the expected number .
Result Green : observed values are larger than the expected value. Red: observed values are smaller than the expected value. Radii: |observed value – expected value|(e.g., Costas, Bordons, van Leeuwen, & van Raan, 2009; Seglen & Aksnes, 2000 )
Result http://www.leydesdorff.net/topcity/figure2.htm