Download
1 / 60
610 likes | 740 Vues
The ALICE muon spectrometer: trigger detectors and quarkonia detection in p-p collisions. M . Gagliardi Università degli Studi & INFN Torino. T. D.: Pr. E. Vercellin. The ALICE experiment. LHC-CERN Collisions: Pb - Pb ( = 5.5 TeV ) Ar-Ar ( = 6.3 TeV ) p-p

E N D
The ALICE muon spectrometer:trigger detectors and quarkonia detection in p-p collisions M. GagliardiUniversità degli Studi & INFN Torino T. D.: Pr. E. Vercellin
The ALICE experiment LHC-CERN Collisions:Pb-Pb ( = 5.5 TeV ) Ar-Ar( = 6.3 TeV )p-p ( = 14 TeV) lighter A-Ahybrid systems(p-A, d-A…) A Large Ion Collider Experiment muon spectrometer(2.5 < < 4)
Outline • Quark-Gluon Plasma, Heavy Ion Collisions, Quarkonia • Trigger detectors for the ALICE muon spectrometer: • - Resistive Plate Chambers for the ALICE muon spectrometer - Testing and characterisation of the final detectors - Results and status • Quarkonia in p-p collisions - Motivation - Quarkonia detection in the muon spectrometer in p-p at 5.5 TeV - Extrapolation of quarkonia cross sections from 14 TeV to 5.5 TeV - Conclusions, outlook
QGP Phase diagram of nuclear matter and QGP QCD asymptotic freedom at high energy and/or density, transition to a deconfined phase with partonic DF: the Quark-Gluon Plasma Critical energy density: 1 GeV/fm3 mB=0:Crossover hadrons-QGP atTc 150÷200 MeV (LQCD)T = 0: mB 1 GeV (rc 5 10 r0 ) F. Karsch, QM 2006 Location and nature of phase transitions still debated
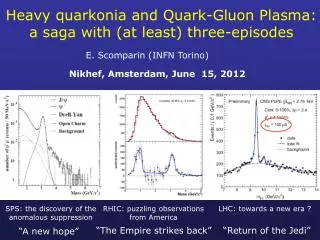
QGP QGP in Heavy Ion Collisions Energy density at thermalisation: 3 GeV/fm3 at SPS 5 GeV/fm3 at RHIC (estimated from ET) Space-time evolution of a heavy-ion collision Final state measurements: QGP signatures “hidden” by hadronisation 20 fm/c QGP studied through a set of probes:- Thermal photons- Jet quenching- Elliptic flow- Strangeness- Quarkonia 1 fm/c Time
When lD decreases below a critical value ~ rQQ,the bound states are expected to be suppressed by colour screening: sequential suppression of resonances with increasing T > TC Recent estimates: TJ/ 2TC , T’ TC (T. Matsui – H. Satz, 1986) Quarkonia suppression by QGP cc: J/ , ’,c…bb: , ’, ’’… J/ suppression observed at SPS and RHIC in central Pb-Pb, In-In, Au-Au collisions (NA50/60, PHENIX) Confinement: QGP: lD = Debye screening length, ~ T-1/2 Interpretation of data is not straightforward:- which states are actually suppressed? - regeneration?
The ALICE muon spectrometer • Studying heavy quark production via their muonic and semi-muonic decays. • mm invariant mass spectrum • Forward rapidity (2.5 < y < 4), xBj 10-5 • Large quarkonia acceptance down to pT 0 • Measurement of quarkonia production - as a function of centrality- as a function of pT, y- for different colliding systems (including p-A)- versus global observables- together with open charm/beauty FRONT ABSORBER(composite material) TRACKING SYSTEM (Cathode Strip Chambers) m FILTER (Fe) BEAM SHIELDING (W) DIPOLEMAGNET B = 0.7 T TRIGGER SYSTEM (Resistive Plate Chambers) 19 m Mass resolution: 70 MeV/c2 at 3 GeV c2 – 100 MeV/c2 at 10 GeV/c2
y2-y2,~ (Z2-Z1)(ZF/Z1)(1/ pT) Muon trigger system • Low-pTmuons mainly come from light meson decays:muon pT cutis performed to reduce the trigger rate (DAQ rate: 1 kHz) • pT is estimated via the muon deviation in magnetic field • trajectory is reconstructed by two trigger stations: each station is made of two planes of position sensitive detectors - Cuts: pT > 1 GeV/c (J/)pT > 2 GeV/c () - 3 / 4 fired planes condition (redundancy)- Efficiency of the trigger algorithm:75 % for J/y, 90% for
INSULATOR HV RESISTIVE PLATES: BAKELITE 2 mm SPACERS(PVC) 2 mm GAS GAP 2 mm GRAPHITE GND READOUT STRIPS Two operation modes AVALANCHE vs STREAMER- time resolution - spatial resolution- detector lifetime- no amplification- rate capability-signal/background Trigger detectors (RPC) Requirements for the trigger detectors satisfied by standard single-gap Resistive Plate Chambers • Muon efficiency 95% • Fastresponse ( 2 ns) • Low sensitivity to and n • Minimise cost/area • Time resolution 1 ns • Spatial resolution cm
Dual threshold discrimination (ADULT) Streamer mode Avalanche mode Low r(few 109 Wcm) SameADULT front-end electronics(Clermont-Ferrand) A-A collisions: streamer mixture50.5% Ar, 41.3% i-C4H10, 7.2% C2H2F4, 1% SF6 ; RH=50% p-p: highly saturated-avalanche 89.7% C2H2F4, 10% i-C4H10, 0.3% SF6 ; RH=50% R. Arnaldi et al., Nucl. Instr. and Meth. 451 (2000) 462, * NIM 457 (2001) 117, NIM 490 (2002) 51, NIM 508 (2003) 106, NIM 533 (2004) 112 R&D on the ALICE RPCs Collision-specific requirements: • Spatial resolution = 1 cm (A-A) • Occupancy as low as possible (A-A) • Rate capability 100 Hz/cm2 (A-A) • Time resolution 1 ns (A-A) • Detector lifetime (107 s/year) (p-p) Requirements in terms of both performance and lifetime fulfilled for A-A * and p-p ** * * R. Arnaldi, MG et al., Nucl. Phys. B (Proc. Suppl.) 158 (2006) 149
The trigger stations MT1 and MT2 • 16 and 17 m from the IP • Each station features two RPC planes • Each plane is made of 18RPCs read on both sides with orthogonal strips. Total: 72 RPCs. • Area covered by each plane: about 6x6 m2 • RPC area : 70x280 cm2 L1 L2 L3 ~ 6.5 m C S C ~ 5.5 m L3 L2 L1 - 3 different shapes: L (Long), C (Cut), S (Short) - 5 different types of segmentation- Strip width: 1 cm, 2cm, 4cm C,S: lower resistivity and finer segmentation Bending plane
Streamer mixture Testing the final detectors Goal:characterise all detectors produced ( 120) and select the 72 final detectors (+ spares) according to well-defined criteria • Preliminary tests: • - Gas leakage detection • - Electrodesresistivity (argon method) • - V-I curve: detection of possible leakage currents • Efficiency measurements: • - Local measurement of efficiency as a function of HV • - Fit, estraction of parameters from curves: HV50%, slope • - High granularity measurement of efficiency at working HV • Noise and current measurements: • - Mean hit rate and noise map (autotrigger method) • - Constant monitoring of dark current at working HV
Efficiency measurements: the test station in Torino Local measurement of efficiency Tracking RPC 1 RPCsunder test Tracking RPC 2 MUON TRACK EXPECTED IMPACT POINT Efficiency measured with cosmic rays (m). The test station is composed of 3 scintillator planes for triggeringand 2 RPCs for tracking, with an active area of 90×150 cm2(enough to test one half-chamber). Scintillator Planes Tracking RPCs Test slots (4 different positions)
Systematic error due to fake tracks: 3÷5 % TRK 1 TESTED RPC’S TRK 2 RECONSTRUCTED TRACK Systematic error evaluated with a dedicated analysis on a few runs (cross-checks with more detectors) About the local measurement of efficiency - Resolution: ~ 1 cm (FWHM) RMS 4 mm • Aim of the efficiency test: verify uniformity, not absolute efficiency- Actual RPC efficiency shall be measured online during data-taking in ALICE
All voltages corrected for T and p Goal: evaluate the uniformity of the detector through the spread of the parameters of the curve in different cells fit Slope: 0.16/100V 50% eff. HV: 7467 V Slope: 0.14/100V 50% eff. HV: 7564 V Efficiency measured as a function of HV in cells of 20x20 cm2 Efficiency curves Parameters unaffected by the systematic error:- HV at 50% efficiency- Slope of the curve
Efficiency maps at working HV PVC spacers( 1 cm) • Area divided in smaller cells(~ 2 x 2 cm2): -about 500 events in central cells ( statistical error < 1%)- about 100 events in peripheral cells ( s. e. < 3%)-about 50 events in side cells (s.e. ~ 3÷4%) Cells 2x2 cm2 All efficiency maps examined to detect imperfections, defined as: raw efficiency < 90% at working HV (8100 and 8200 V)
Noise measurements: autotrigger • Trigger: events with at least one hit on both planes of the RPC. • Count the number of hits at every strip crossing • Divide by elapsed time and crossing area to obtain single countingrate (Hz/cm2) • Correct for DAQ dead time • Repeat the measurement over a wide range of HV’s • Measure the mean rate • Count the number of hot spots(rate > 5,10,20 Hz/cm2) HV: 8200V Hz/cm2 Strip x Strip x Strip y Strip y (A few) problematic detectors may present hotspots with rates up to several tens of Hz/cm2
200 V Distribution of the voltage range in which all cells reach 50% efficiencyMean voltage range: (300± 70) V Efficiency curves: results Evaluation of the uniformity RMS/MEAN < 1% Cells HV at 50% efficiency (V) For each detector, plot HV50 distribution over all cells. Find the spread of HV50
Efficiency maps: results … not this! We want this… Cells 2x2 cm2
Efficiency maps: results (II) The population of tested detectors can be divided in four classes: 57% of all produced detectors: uniform, high efficiency throughout the whole surface 17% of all produced detectors: small regions (max 6x6 cm2) with raw efficiency slightly below 90% 12% of all produced detectors: many small regionsslightly below 90% , or larger zones below 90% 6% of all produced detectors: very large regions below 90%; regionswell below 90% 8%: discarded during preliminary tests, efficiency not measured
Peak around 0.10÷0.15 nA/cm2( 2mA) Mean rate: peak around 0.1 Hz/cm2 Noise and current measurements: results Mean # of hot spots: 5÷10 Hz/cm2:6 10÷20 Hz/cm2:3> 20 Hz/cm2 :2 Both distributions: peak + tail (problematic detectors lie in the tail) Both rate and current: no correlation with resistivity was observed
Five quality classes (0 to 4) Rated 0:construction flawsRated 1:insufficient performances Rated 2:sufficient performances Rated 3: good performancesRated 4: excellent performances (> 20 Hz/cm2) Selection criteria and final results Detectors evaluated on the basis of efficiency maps (inspected one by one) uniformity (RMS of HV50), noise (mean rate and number of hot spots), current Common to all detectors rated 2:only very small (if any) imperfections in the efficiency map
Conclusions and status • All RPCs characterised, data stored in a database • Of all produced detectors:17% : discarded for construction flaws (8%) or insufficient performances (9%)26%: sufficient, selected for use in peripheral regions or as spares57%: good (33%) or excellent (24%) performances- 72 final detectors selectedand installedin ALICE- Commissioning start date: December 2007- A few spares ( 15) missing- More RPCs to be produced and tested
At the LHC: Pb-Pb: = 5.5 TeV Task: evaluate s (pp -> X) at = 5.5 TeV p-p: = 14 TeV RAA meaningful if: Motivation One of the main observables for quarkonia suppression studies: the nuclear modification factor RAA X = J/y, ...c = a centrality-related quantity MEASUREMENT EXTRAPOLATION
Strategy # 1:direct measurement in a dedicated p-p run at 5.5 TeV Not in the present LHC schedule, may be available in a subsequent phase Evaluation of the physics performance of the ALICE muon spectrometer in a p-p run at 5.5 TeVby means of simulation • Input parametrisations • Reconstruction • Expected yields and efficiencies • Measurement of differential cross sections
(R. Vogt) Simulation approach and input Same frame as for the 14 TeV case*: • - Quarkonia generationaccording to Color Evaporation Model (CEM) predictions: • Total cross section (NLO, MRST PDF) • pT distribution: rescaling of CDF results ( = 1.96 TeV) according to CEM prescription • Rapidity distribution: NLO CEM, MRST • - Quarkonia decay in m+m- (PYTHIA) AssumeL = 3 x 1030 s-1cm-2, 106 s data taking - Reconstruction withfast simulation * ALICE Collaboration, J. Phys. G: Nucl. Part. Phys. 32 (2006)
Fit of pt distribution as measured by CDF ( = 1.96 TeV) CEM: Input quarkonia pT distribution: rescaling from CDF CEM gives predictions* for the evolution of with *Accardi et al.,hep-ph/0308248 Rescaling to 5.5 TeV:n kept constantK2increased to match CEM value New value fed back in dN/dpTto obtain rescaled distribution
Input pT distributions J/y
Input rapidity distributions (R. Vogt, NLO CEM) J/y
Non-vanishing efficiency at pT = 0 J/y Quarkonia detection probability in pT and y bins 2.5 < y < 4 2.5 < y < 4 pT J/y y
Reconstructed y distributions at 5.5 TeV J/y J/: fine bins, statistical error < 2%: larger bins, statistical error < 8%
Reconstructed pT distributions at 5.5 TeV J/y J/: fine bins up to 15 GeV/c, statistical error < 8%: fine bins up to 10 GeV/c, statistical error < 10% 2.5 < y < 4 2.5 < y < 4
Efficiencies & yields at 5.5 TeV - Conclusions Total muon spectrometer acceptance x efficiency: (over all phase space)- for J/y: 2.8%- for : 3.6% Similar values were found at = 14 TeV Quarkonia yields in the muon spectrometer in 106 s at 3 x 1030 s-1cm-2: 152400 ± 400 prompt J/y1300 ± 40 CAVEAT: signal analysis only, prompt J/ onlyMore refined study: background, J/ from B-decay
Strategy # 2Extrapolation of quarkonia cross sections from 14 TeV to 5.5 TeV • Rescaling factors (total and in pT bins) evaluated in the frame of NLO CEM • LO investigation of the effect of PDFs and mF on the uncertainty
Definitions If p-p measurement is only performed at 14 TeV, need to compute a scaling factor (models). Muon spectrometer acceptance:2.5 < y < 4. J/y
Scaling factor in the pT bin [pT,1, pT,2]: dN/dpT normalised to unity Scaling factors
Leading Order Color Evaporation Model LO formulae used to investigate theoretical uncertainty by varying mF and by using different PDF sets (dominant diagram gg->QQ only) Cross section for quarkonia production: some fraction Fc of the QQ cross section below the open c/b threshold.Fcindependent of kinematics, process, .
Gluon distribution functions mF = 2.4 GeV 2mc mF = 9 GeV 2mb
J/y rapidity distributions (NLO) (NLO)
rapidity distributions (NLO) (NLO)
Results with different PDFs (NLO) (NLO) No PDF dependence of the pT distribution taken into account (same relative spread for all pT bins)
J/y Relative spreads 4% 8% (Max – Min) /2 Ave • LO relative spreads: 4% for J/y, 8% for • Spreads compatible with luminosity uncertainty (5÷10%) • 15% discrepancy between LO and NLO scaling factors • Uncertainty arising from mF negligible w. r. t. PDF • J/y y-distribution at 14 TeV can constrain PDF* * ALICE-INT-2006-029
First estimate of the scaling factors • LO uncertainty from PDF: < 10% • NLO to be fully investigated • Outlook: vary production model • Measurement feasible • Statistics: 152000 J/y (stat err. on total s < 1%) 1300 (stat err. on total s~ 3%) • Differential cross sections may be measured with statistical errors < 10%- Systematics not considered yet • Outlook: p-p like systems Conclusions and outlook • Both measurement and extrapolation investigated
2 linseed oil layers • ageing proportional to integrated current per surface unit (mC/cm2), • i.e. to the integrated hits per surface unit (Mhit/cm2) • possible effects: -increase of dark current and single rate -efficiency loss R & D on ageing effects • the R&D program to understand the RPCs ageing problems was focused on two aspects: • effects due to flowing the RPCs with dry gas • gincrease of bakelite resistivity • effects due to long-term operation of the detector in condition of high counting rates • increase of bakelite resistivity, due to the conduction mechanism • surface damaging, due to streamer discharge RPCs for the ALICE Muon Trigger System • low resistivity (109Wcm) • wet gas mixture Ageing tests already performed for the streamer mode: The detector lifetime was found to be compatible with the ALICE heavy ions data-taking program** R.Arnaldi et al., Nucl. Instr. and Meth.A 533 (2004) 112
PRELIMINARY Saturated Avalanche mixture Test in Torino with cosmic rays,to check efficiency map: Irradiation at GIF (CERN), to simulate ALICE working conditions First results presented @ RPC2005, proceedings on Nucl. Phys. B 158 (2006)
mean rate: <2 Hz/cm2 • hot spot (beam-gas interaction*) : • 10 Hz/cm2 g 1-2 RPCs • Integrated hits: • ~20 Mhit/cm2 per year • ~100 Mhit/cm2 per year in the hot spot R. Guernane et al., ALICE-INT-2003-041 Study of a highly-saturated avalanche gas mixture (89.7% C2H2F4, 10% i-C4H10, 0.3% SF6 ; RH=50%) Signal amplitude > 10 mV (min. threshold of Front End Electronics) Mixture performances tested with m-beam (SPS), with and without irradiation (GIF): efficiency, space and time resolution fulfill the requirements Ageing in p-p collisions Higher beam intensity beam-gas interaction!gageing effects more important in p-p: Detector occupancy and trigger rate much smaller in p-p w.r.t. A-A: gspace resolution requirements less strict in p-p