Download
1 / 33
330 likes | 336 Vues
Changes in River - Land Uses and Management: Implications for Salmonid Habitat Restoration in the Cedar River, Washington Robert Wissmar and Ray Timm University of Washington.

E N D
Changes in River - Land Uses and Management: Implications for Salmonid Habitat Restoration in the Cedar River, WashingtonRobert Wissmar and Ray TimmUniversity of Washington Goal: Develop societal-ecological approaches that can be applied to restoration initiatives and management policies at different landscape scales
Restoration Studies of theCedar River • Part I: Changes in Developed Land Cover 1991-1998, Wissmar et al. (2000) • Changes in Developed Land Cover, Wissmar et al. (2000) • Impervious Land Cover Assessment, Logsdon et al. (In review) • Changes in Tributary Hydrology, Wissmar et al. (In prep.) • Part II: Land Use Influences on Floodplains: Implications for Habitat Restoration and Protection • Habitat Prioritization, Timm et al. (In review) • Protection of Riparian Habitats in Erosion-prone Landscapes, Wissmar et al. (In prep) • Part III: Habitat Selection by Salmonids, Hall et al. (2000, 2002) • Implications for Habitat Restoration • Part IV: Disturbance Regimes, Habitat Interactions and Restoration Across Riverine Landscapes, Timm, Ph.D. Diss. (In prep)
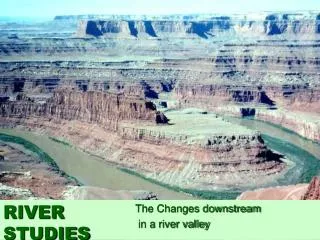
PART I: Basinwide AnalysisLand Cover Changes: 1991 - 1998 What is the change in developed land cover? • Identified major locations of changes in developed land cover • Changes in developed land cover layer indicates increases in impervious areas
PART I: Basinwide AnalysisLand Cover Changes: 1991 - 1998 Why do we have patterns of change in human development? • Urban areas (Downstream region) • Widening of major highway on floodplains • Conversion of isolated forest areas by infill development • Rural - urbanizing areas (Upstream region - newly incorporated) • Dispersed conversion • Aggregation • Edge expansion
Assessing land-hydrologic changes in Cedar River tributaries • Develop land covers for evaluating landscape changes • Changes in developed areas • Analyze the extent of impervious (NDVI) • Quantify changes in developed land cover between 1991 and 1998 that could influence the hydrological processes of watersheds, riparian and aquatic habitats • Use coverages in a fine-resolution spatial hydrological model adapted from Wigmosta, et al. (1994) to assess the impact of land-use change on stream discharge for 1991, 1998, and historical landscapes • Use above information and DHSVM to simulate flooding of lowland areas within different tributary watersheds. • Compare simulations for 1991, 1998, and historical landscapes
Maplewood Creek Hydrologic Changes • Impact of landcover changes on discharge was evident in comparisons of changes in the percent differences ( %) in annual peak flow for various recurrence intervals (years). • Years Hist. 1991 1998 91-98 Hist-91 Hist-98 ----------Discharge (cfs)-------------- ---------------- (% )------------------ • 20 46 70 75 7 52 63 • 60 74 108 120 11 46 62 • 100 78 117 130 11 50 67 • Between 1991 and 1998, changes in annual peak flow were 7%, 11%, and 11%, at the 20, 60 and 100 year recurrence intervals, respectively. • Much greater differences in discharge rates were evident between historical conditions and the developed 1998 landscape. The annual peak flow ranged between 62% and 67% for the same return intervals. • Similar changes were evident for differences between historical and 1991 conditions (46 to 52%).
140 cfs (91) cfs (98) cfs (Hist) 120 100 80 Discharge (cfs) 60 40 20 0 0 20 40 60 80 100 Recurrence interval (years)
PART II: River Restoration and Protection Analysis Spatial distributions of ecologically functional and human-influence zones along rivers, Timm et al. (In review) • How are ecologically functional habitats and anthropogenically altered areas influencing riverine habitats within the floodplain? • Can co-occurring, ecologically functional and anthro-pogenic landcovers be used to identify opportunities for habitat restoration within the floodplain? Land-use practices and erosion risk potential, Wissmar et al. (In prep.) • Risks created by human land and water use practices within naturally unstable areas lead to cumulative impacts on ecosystem functions • Risk assessments facilitate planning and implementation
Lower Cedar Basin Restoration Potential -4 -3 -2 -1 0 +1 +2 +3 +4
Protection of Riparian Habitats in Erosion-prone Landscapes Objectives • Determine erosion risk scores that indicate the absence and presence of different factors contributing to erosion hazards • Assess the spatial distribution of erosion risks in watersheds • Identify variable riparian buffer widths assigned to erosion risk scores
FACTORS ABSENT FACTORS PRESENT = 2 = 1 Rain on Snow elevations + Unstable soils + Immature forest stands + Roaded areas + Critical slopes EROSION RISK SCORE
Part III: Salmon Habitat Selection • Habitat Selection by Salmonids, Hall et al. (2000, 2002) • What habitat factors do spawning salmon prefer? • What habitat factors do juvenile salmon prefer? • Implications for Habitat Restoration • What is the predicted fish response to restoration/ mitigation prescriptions? • Can we incorporate this into restoration plans?
Spawning Objectives • Identify important habitat variables • Measure habitat selection • Explore role of density on habitat selection
W79 CAV Areas with high amounts of detritus were not used Upwelling areas were highly selected Redd depths were within expected ranges Fish chose areas with gravel and cobble substrates Temperatures were within suitable spawning and incubation ranges When many sockeye were present, the range of habitat types used expanded: -Substrate -Detritus depth -Depth There was substantial use of the newly constructed side-channel habitats Spawning Conclusions W79 = Wetland 79, CAV = Cavanaugh Pond
Juvenile Sockeye SalmonObjectives • Determine selected ranges of habitat factors considering day-night and seasonal differences • Examine how fish size and fish density affects habitat use • Investigate overlap with potential predators • Identify extent of use in the newly constructed habitat at Wetland 79
Juvenile Conclusions Juvenile habitat use appeared to be driven by the threat of predation. -moved to deeper areas to avoid predation from birds -formed larger schools as protection from aquatic predators -majority of fish used cover -preferred complex woody debris Fish appeared to avoid warmer temperatures and low dissolved oxygen levels, however, it remains uncertain how these factors may limit habitat use. Sockeye did not select for other habitat factors.
Part IV Disturbance, Habitat Protection and Restoration • Disturbance Regimes, Habitat Interactions and Restoration Across Riverine Landscapes, Timm, Ph.D. Dissertation (In prep) • Evaluating how ecologically functional and anthropogencially developed areas influence riverine/ floodplain habitats • Spatially modeling interactions between channel hydraulics and local floodplain hydrology • Testing procedures to identify opportunities for habitat restoration within the basin
Acknowledgements • U.S. EPA Grant # R827149-01-0 • PRISM • King County • City of Renton • City of Seattle • U.S. Forest Service • U.S. Army Corps of Engineers • Washington Dept. of Fish & Wildlife