Download
1 / 25
250 likes | 253 Vues
Quantitative Methods PSY302 Quiz Normal Curve Review. 400 16 100. 600 34% Can’t say. 1. For these data the mean is 500 and the standard deviation is:. 400 16 100. 600 34% Can’t say. 1. For these data the mean is 500 and the standard deviation is:.

E N D
400 16 100 600 34% Can’t say 1. For these data the mean is 500 and the standard deviation is:
400 16 100 600 34% Can’t say 1. For these data the mean is 500 and the standard deviation is:
2. In 2002 the scores of men on the math SAT had a mean of 534 and standard deviation of 116. Bob scored 750. What is the z-score for 750? • -1.25 • 1.86 • 2.27 • 0 • -.25
2. In 2002 the scores of men on the math SAT had a mean of 534 and standard deviation of 116. Bob scored 750. What is the z-score for 750? • -1.25 • 1.86 • 2.27 • 0 • -.25
3. Attendance at a university’s basketball games follows a normal distribution with mean = 8,000 and standard deviation = 1,000. Estimate the percentage of games that have between 7,000 to 9,000 people in attendance. • 68% • 95% • 99.7%
3. Attendance at a university’s basketball games follows a normal distribution with mean = 8,000 and standard deviation = 1,000. Estimate the percentage of games that have between 7,000 to 9,000 people in attendance. • 68% • 95% • 99.7%
6. When a distribution is skewed it: • is not useful • departs from symmetry • has a mean equal to the median • is based on measurement data • is normal
6. When a distribution is skewed it: • is not useful • departs from symmetry • has a mean equal to the median • is based on measurement data • is normal
7. The WAIS IQ test has a mean of 100 and a standard deviation of 15. What percent of people score below 100 on this IQ test? • 1. 100% • 2. 75% • 3. 50% • 4. 25% • 5. 99.7%
7. The WAIS IQ test has a mean of 100 and a standard deviation of 15. What percent of people score below 100 on this IQ test? • 1. 100% • 2. 75% • 3. 50% • 4. 25% • 5. 99.7%
8. To describe a normal distribution you need the ____ and the standard deviation. • 1. hypotenuse • 2. skewness • 3. standard score • 4. mean • 5. Z score
8. To describe a normal distribution you need the ____ and the standard deviation. • 1. hypotenuse • 2. skewness • 3. standard score • 4. mean • 5. Z score
9. The mean score on the WAIS IQ scale is 100 with a standard deviation of 15. Someone who got a score of 90 would have a z-score of: • 1.96 • .75 • .68 • -1.2 • -.67
9. The mean score on the WAIS IQ scale is 100 with a standard deviation of 15. Someone who got a score of 90 would have a z-score of: • 1.96 • .75 • .68 • -1.2 • -.67
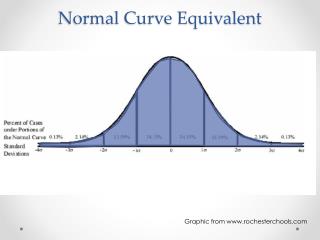
10. What percentage of scores lie within two standard deviations of the mean? • 0% • 50% • 68% • 95% • 103%
10. What percentage of scores lie within two standard deviations of the mean? • 0% • 50% • 68% • 95% • 103%
Bonus Question: What percent of scores lie below a Z-score of +1? • 40% • 50% • 84% • 95% • 100%
Bonus Question: What percent of scores lie below a Z-score of +1? • 40% • 50% • 84% • 95% • 100%
C • B • D • A • E • C • C • E • D • E