Download
1 / 1
10 likes | 131 Vues
Water Quality Forecasting in the San Joaquin River Basin Taiki Murakami, Nigel W.T. Quinn PhD, P.E., D.WRE HydroEcological Engineering Advanced Decision Support (HEADS), Lawrence Berkeley National Laboratory, Berkeley, CA . Introduction. Results. Discussion.

E N D
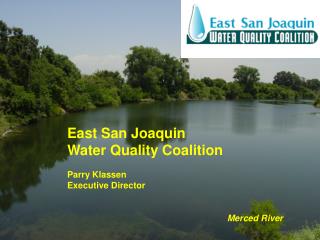
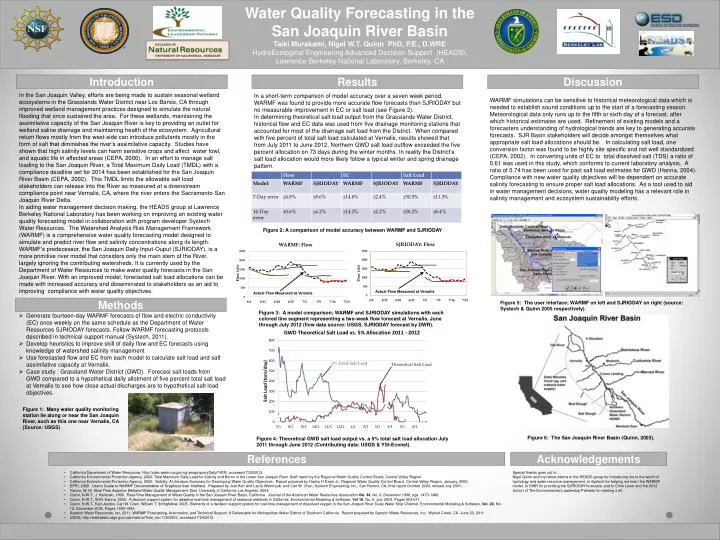
Water Quality Forecasting in the San Joaquin River Basin Taiki Murakami, Nigel W.T. Quinn PhD, P.E., D.WRE HydroEcologicalEngineering Advanced Decision Support (HEADS), Lawrence Berkeley National Laboratory, Berkeley, CA Introduction Results Discussion In the San Joaquin Valley, efforts are being made to sustain seasonal wetland ecosystems in the Grasslands Water District near Los Banos, CA through improved wetland management practices designed to simulate the natural flooding that once sustained the area. For these wetlands, maintaining the assimilative capacity of the San Joaquin River is key to providing an outlet for wetland saline drainage and maintaining health of the ecosystem. Agricultural return flows mostly from the west-side can introduce pollutants mostly in the form of salt that diminishes the river’s assimilative capacity. Studies have shown that high salinity levels can harm sensitive cropsand affect water fowl, and aquatic life in affected areas (CEPA, 2000). In an effort to manage salt loading to the San Joaquin River, a Total Maximum Daily Load (TMDL) with a compliance deadline set for 2014 has been established for the San Joaquin River Basin (CEPA, 2002). This TMDL limits the allowable salt load stakeholders can release into the River as measured at a downstream compliance point near Vernalis, CA, where the river enters the Sacramento-San Joaquin River Delta. In aiding water management decision making, the HEADS group at Lawrence Berkeley National Laboratory has been working on improving an existing water quality forecasting model in collaboration with program developer Systech Water Resources. The Watershed Analysis Risk Management Framework (WARMF) is a comprehensive water quality forecasting model designed to simulate and predict river flow and salinity concentrations along its length. WARMF’s predecessor, the San Joaquin Daily Input-Ouput (SJRIODAY), is a more primitive river model that considers only the main stem of the River, largely ignoring the contributing watersheds. It is currently used by the Department of Water Resources to make water quality forecasts in the San Joaquin River. With an improved model, forecasted salt load allocations can be made with increased accuracy and disseminated to stakeholders as an aid to improving compliance with water quality objectives. In a short-term comparison of model accuracy over a seven week period, WARMF was found to provide more accurate flow forecasts than SJRIODAY but no measurable improvement in EC or salt load (see Figure 2). In determining theoretical salt load output from the Grasslands Water District, historical flow and EC data was used from five drainage monitoring stations that accounted for most of the drainage salt load from the District. When compared with five percent of total salt load calculated at Vernalis, results showed that from July 2011 to June 2012, Northern GWD salt load outflow exceeded the five percent allocation on 73 days during the winter months. In reality the District’s salt load allocation would more likely follow a typical winter and spring drainage pattern. WARMF simulations can be sensitive to historical meteorological data which is needed to establish sound conditions up to the start of a forecasting season. Meteorological data only runs up to the fifth or sixth day of a forecast, after which historical estimates are used. Refinement of existing models and a forecasters understanding of hydrological trends are key to generating accurate forecasts. SJR Basin stakeholders will decide amongst themselves what appropriate salt load allocations should be. In calculating salt load, one conversion factor was found to be highly site specific and not well standardized (CEPA, 2002). In converting units of EC to total dissolved salt (TDS) a ratio of 0.61 was used in this study, which conforms to current laboratory analysis. A ratio of 0.74 has been used for past salt load estimates for GWD (Hanna, 2004). Compliance with new water quality objectives will be dependent on accurate salinity forecasting to ensure proper salt load allocations. As a tool used to aid in water management decisions, water quality modeling has a relevant role in salinity management and ecosystem sustainability efforts. Figure 2: A comparison of model accuracy between WARMF and SJRIODAY Actual Flow Measured at Vernalis Actual Flow Measured at Vernalis Methods Figure 5: The user interface; WARMF on left and SJRIODAY on right (source: Systech & Quinn 2005 respectively). Figure 3: A model comparison; WARMF and SJRIODAY simulations with each colored line segment representing a two-week flow forecast at Vernalis, June through July 2012 (flow data source: USGS, SJRIODAY forecast by DWR). • Generate fourteen-day WARMF forecasts of flow and electric conductivity (EC) once weekly on the same schedule as the Department of Water Resources SJRIODAY forecasts. Follow WARMF forecasting protocols described in technical support manual (Systech, 2011). • Develop heuristics to improve skill of daily flow and EC forecasts using knowledge of watershed salinity management • Use forecasted flow and EC from each model to calculate salt load and salt assimilative capacity at Vernalis. • Case study : Grassland Water District (GWD). Forecast salt loads from GWD compared to a hypothetical daily allotment of five percent total salt load at Vernalisto see how close actual discharges are to hypothetical salt load objectives. Figure 1: Many water quality monitoring station lie along or near the San Joaquin River, such as this one near Vernalis, CA (Source: USGS) Figure 6: The San Joaquin River Basin (Quinn, 2003). Figure 4: Theoretical GWD salt load output vs. a 5% total salt load allocation July 2011 through June 2012 (Contributing data: USGS & YSI-Econet). Acknowledgements References • California Department of Water Resources, http://cdec.water.ca.gov/cgi-progs/queryDaily?VER, accessed 7/24/2012. • California Environmental Protection Agency, 2002. Total Maximum Daily Load for Salinity and Boron in the Lower San Joaquin River. Staff report by the Regional Water Quality Control Board, Central Valley Region. • California Environmental Protection Agency, 2000. Salinity: A Literature Summary for Developing Water Quality Objectives. Report prepared by Harley H Davis Jr., Regional Water Quality Control Board, Central Valley Region, January, 2000. • EPRI, 2000. User’s Guide to WARMF Documentation of Graphical User Interface. Prepared by Joel Herr and Laura Weintraub, and Carl W. Chen, Systech Engineering, Inc., San Ramon, CA, final report October 2000, revised July 2001. • Hanna, W. M. Real-Time Adaptive Wetland Water Quality Management. Diss. University of California Los Angeles, 2004. • Quinn, N.W.T., J. Karkoski, 1998. Real-Time Management of Water Quality in the San Joaquin River Basin, California. Journal of the American Water Resources AssociationVol. 34, No. 6, December 1998, pgs. 1473-1486. • Quinn, N.W.T., W.M. Hanna, 2003. A decision support system for adaptive real-time management of seasonal wetlands in California. Environmental Modeling & Software, Vol 18, No. 6, July 2003, Pages 503-511. • Quinn, N.W.T., Karl Jacobs, Carl W. Chen, William T. Stringfellow, 2005. Elements of a decision support system for real-time management of dissolved oxygen in the San Joaquin River Deep Water Ship Channel, Environmental Modeling & Software, Vol. 20, No. 12, December 2005, Pages 1495-1504. • SystechWater Resources, Inc, 2011. WARMF Forecasting, Automation, and Technical Support. A Deliverable for Metropolitan Water District of Southern California. Report prepared by Systech Water Resources, Inc., Walnut Creek, CA. June 23, 2011. • USGS, http://waterdata.usgs.gov/usa/nwis/uv?site_no=11303500, accessed 7/24/2012. Special thanks goes out to : Nigel Quinn and my fellow interns in the HEADS group for introducing me to the world of hydrology and water resource management, to Systechfor helping me learn the WARMF model, to DWR for providing the SJRIODAY forecasts, and to Chris Lever and the 2012 Cohort of The Environmental Leadership Pathway for starting it all.