Download
1 / 71
710 likes | 715 Vues
This economic forecast examines the growth and trends in the Inland Empire region, including record job levels, potential recession predictors, job quality, educational challenges, and the impact of healthcare and logistics on job growth.

E N D
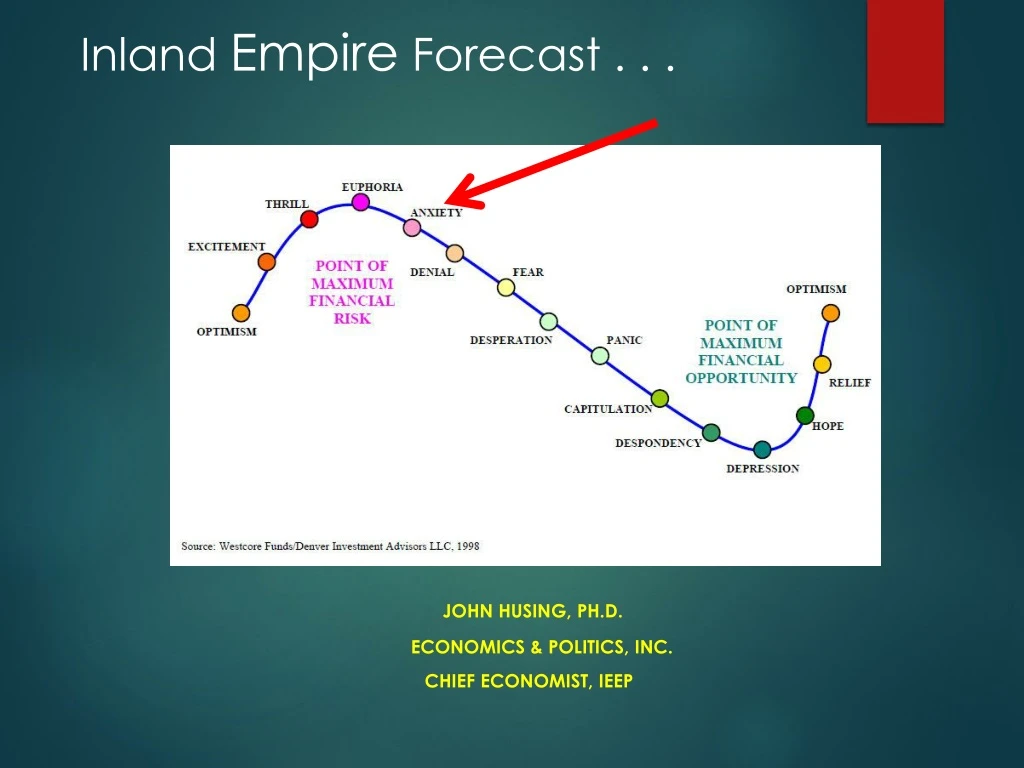
Inland Empire Forecast . . . John Husing, Ph.D. Economics & Politics, Inc. Chief Economist, IEEP
18.0% Add Potential Workers: Given Up Or Part Time 10.6% 7.4% 3.7%
Inflation Worry 3.9% 2.3%
Interest Rates: 4 Short Term Rate Increases 4.83% 3.20%
Yield Curve: Potential Recession Predictor 2 Year to 10 Year 0.30%
Inland Empire Population Greater Than 25 of 50 States
Inland Empire’s Powerful Job Growth! Percent 2018e above 2007 I.E. CA US 16.1% v. 9.8% v. 8.2% Confession Forecast: 46,600 jobs 3.3% 5.5% Unemployment Actual: 49,433 Jobs 3.5% 5.1% Unemployment
Job Growth by Region 2nd Largest 2017 Absolute Job Gain in CA!
Inland Empire Growth Fastest 2017 Job Growth Rate in CA!
Poverty Falling With Job Creation 23.5% 16.4%
Educational Challenge 46.3% 29.2%
$ Payroll Spent $ Payroll Spent Moon Mining Corp. $ Payroll Paid
Health Care Job Growth Strongest High Paying Sector 2011-2018 9.6% of Job Growth
Median Health Care Pay: 2018 $62,363
ACA Impact Health Care Demand & Quality of Life -60% Drop in Uninsured
Residents Per Health Care Worker +26.0% More People 33.5 26.6 Sources: Department of Finance, Demographic Research Unit; CA Employment Development Department
Logistics Job Growth Without Logistics growth, IE would still be in Recession 2011-2018 23.6% of Job Growth
Median Logistics Pay: 2018 $47,946
Skill Ladders Based on Education for PositionMedian Pay Warehousing, Inland Empire 2018
E-Commerce 1.1% 9.6% 15.5%
Net Industrial Absorption 21.9 million
Industrial Rates & Vacancies Lease Rates Per Square Foot Per Month Inland Empire $0.53 3.9% Ventura $0.70 2.5% Los Angeles $0.89 1.1% Orange $0.91 1.5% San Diego $0.90 4.1% Source: CB Richard Ellis
Industrial Lease Rates Up 22.1% Up 76.7%
ONT Airport Cargo Record Volume 18.2%
Manufacturing Job Growth 2011-2018 4.0% of Job Growth
2018 Median Manufacturing Pay $54,800
CA Electrical Cost +74.6% +83.5% +135.4%
Construction Job Growth 2011-2018 12.4% Of Job Growth
Median Construction Pay: 2018 Best Paying Blue Collar Sector $53,322
Home Prices FHA Conforming Loan Limit: $405,950 LA/OC is $679,650 +3.7% -10.2%
Price Competition Highest Price Gaps In History
Apartment Rates/Vacancy, 2018 Inland Empire $1,487 3.8% San Diego $1,978 3.9% Ventura $1,983 3.9% Orange $2,035 4.1% Los Angeles $2,267 4.0% Source: USC Lusk Center For Real Estate