Download
1 / 24
240 likes | 360 Vues
The Combined Margin Approach: Issues and Options. Michael Lazarus, SEI/Tellus World Bank Power Sector Workshop Caesar Park Hotel, Buenos Aires December 8, 2004. Overview of Presentation. The problem The options The combined margin approach

E N D
The Combined Margin Approach: Issues and Options Michael Lazarus, SEI/Tellus World Bank Power Sector Workshop Caesar Park Hotel, Buenos Aires December 8, 2004
Overview of Presentation • The problem • The options • The combined margin approach • Underlying rationale and practical considerations • Strengths and weaknesses • Next steps and new directions
What’s the problem? • Power sector projects and CERs depend on an unknowable counterfactual baseline • CERs = MWhproject x (tCO2/MWhbaseline - tCO2/MWhproject) • Baseline methodologies should balance • Accuracy • Feasibility (cost and data availability) • Transparency • Consistency (over time and space) • Credibility • Standardize or proliferate? • Rely on simple or complex models?
A CDM electricity project might affect: • The choice and/or timing of new power plants (or life extension of existing ones), i.e. the build margin, and/or • The operation of existing power plants, i.e. the operating margin, • Depending on • Context: excess capacity, suppressed demand, fixed investments • Project characteristics: peak vs. baseload, load-following vs. resource-driven (firm vs. non-firm) • Market behavior: plans, intuition, and time-scale of interest (short-term vs. long-term) • Project size: Cumulative effects of small projects, delay vs. displace new capacity additions
Potential impact of a small CDM project The maroon area shown above may represent delayed (i.e. avoided) new generation capacity.
What are the methodological options… …assuming that a CDM project has a mix of build and operating margin effects? • Use a model capable of reflecting all effects • full simulation or optimization models (not just dispatch) • Use models or algorithms to estimate each effect separately, and then combine them: • E.g. consolidated/small-scale CDM methodology, “CERUPT” methodology, consolidated CDM (ACM0002) • Decide which effect predominates and ignore the other
ACM0002 combined margin approach Calculate a baseline emission factor EFyas the weighted average of the Operating Margin emission factor (EF_OMy ) and the Build Margin emission factor (EF_BMy,): EFy = (wOM * EF_OMy) + (wBM * EF_BMy) where the weights wOM and wBM, by default, are 50% (i.e., wOM = wBM = 0.5)
OM and BM methods CDM Consolidated methodology (ACM002) currently contains: • 4 optionsfor calculating the operating margin: • Simple OM: Weighted-average emission rate excluding low-operating cost and must-run power plants • Simple Adjusted OM: Including some must-run/low-cost resources (e.g. hydro) where they dominate a grid • Dispatch data analysis OM • Average OM
And 1 option for calculating the build margin: …the generation-weighted average emission factor of a sample of power plants m, as follows, EF_BMy = FUEL USE * EMISSION COEFF/GENERATION where the sample group m consists of either the 5 most recent or the most recent 20% of power plants built or under construction, whichever group’s average annual generation is greater (in MWh); • Option of ex ante or ex post analysis for either OM or BM
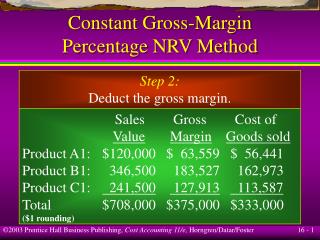
Note CERUPT (2002) methodology shown here differs from ACM0002 Combined margin results: CERUPT example
Potential applications of the combined margin method • Zero or near-zero emission sources • renewable energy • energy efficiency? • several AMs and ACM0002 • Lower-emission sources • Combined heat-and-power • New natural gas plants? • Added production from plant upgrade or repowering? • Uncertainties or errors have a much larger relative impact on lower-emission sources • Difference between project and baseline emission rates (tCO2/MWh) may be quite small
Strengths Relative simplicity and feasibility: low-cost, manageable data and skill requirements Incorporation of both OM and BM effects Consistent and comparable across regions and projects Relatively transparent and credible: data verifiable Weaknesses/challenges Applicability to larger investments, lower-emission (e.g. natural gas) projects Justification of OM/BM weights (50/50 or other) Dependence on lumpy, historical data for build margin Application of dispatch analysis Reflection of local market and operational conditions What are its strengths and weaknesses?
Next steps and new directions • Enhancing the consolidated CDM methodology • More forward-looking, less volatile build margin methods • Weighting the operating and build margins based on project, context, and other factors • Standardized methods to fill “data gaps” • Applying/extending dispatch analysis and hydro-based system methods • Developing other methods • Model-based methodologies that are transparent and credible • Cross-country, cross-context comparisons • Complementary mechanisms to support low-GHG power sector investments and strategies?
Summary • Combined margin is an umbrella term for any method that accounts for a project’s effects on both what is built and what operates in the future. • Simplified CM approaches can balance many competing objectives (accuracy, feasibility, consistency, transparency, credibility) • Considerable scope for improvement and new approaches
Electricity Imports in ACM0002 For the purpose of determining the Operating Margin (OM) emission factor, as described below, use one of the following options to determine the CO2 emission factor(s) for net electricity imports (COEFi,j,imports) from a connected electricity system within the same host country(ies): (a) 0 tCO2/MWh, or (b) the emission factor(s) of the specific power plant(s) from which electricity is imported, if and only if the specific plants are clearly known, or (c) the average emission rate of the exporting grid, if and only if net imports do not exceed 20% of total generation in the project electricity system, or (d) the emission factor of the exporting grid, determined as described in steps 1,2 and 3 below, if net imports exceed 20% of the total generation in the project electricity system. For imports from connected electricity system located in another country, the emission factor is 0 tons CO2 per MWh.
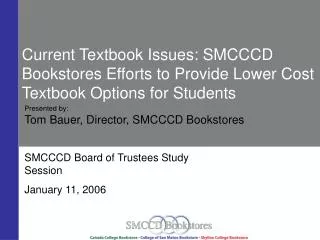
Historical build margin (US) Capacity additions, recent and projected,–United States
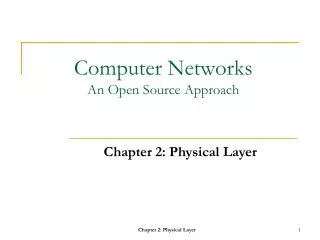
Example of weekly dispatch Geotérmica Nuclear Eólica Ciclo Combinado Carbón Dual Hidráulica Vapor Turbogás 1 6 12 18 24 6 12 18 24 6 12 18 24 6 12 18 24 6 12 18 24 6 12 18 24 6 12 18 24 5 al 12 de diciembre de 1999 GWh/h 30,000 25,000 20,000 15,000 10,000 5,000 0 Domingo Lunes Martes Miércoles Jueves Viernes Sábado