Download
1 / 58
580 likes | 609 Vues
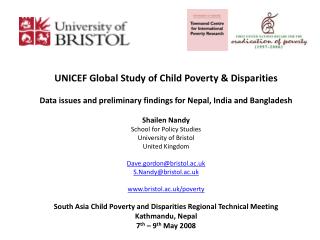
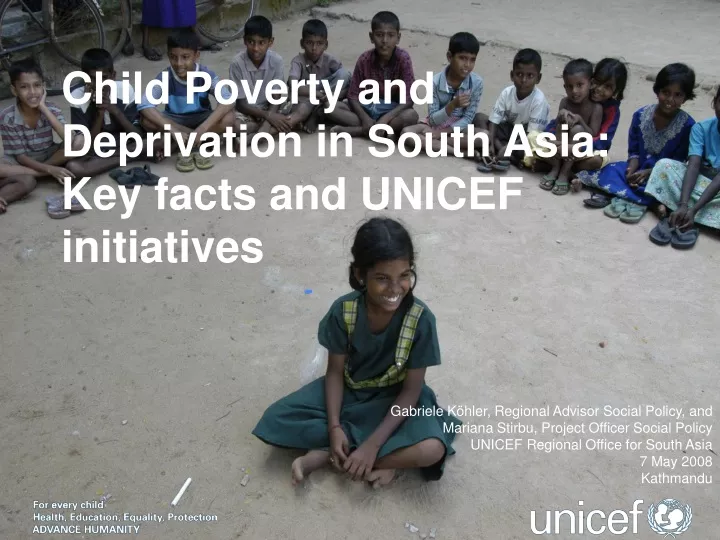
Child Poverty and Deprivation in South Asia: Key facts and UNICEF initiatives. Gabriele K öhler, Regional Advisor Social Policy, and Mariana Stirbu, Project Officer Social Policy UNICEF Regional Office for South Asia 7 May 2008 Kathmandu. Outline of the presentation.

E N D
Child Poverty and Deprivation in South Asia:Key facts and UNICEF initiatives Gabriele Köhler, Regional Advisor Social Policy, and Mariana Stirbu, Project Officer Social Policy UNICEF Regional Office for South Asia 7 May 2008 Kathmandu
Outline of the presentation • SOUTH ASIA – Key facts on poverty and inequality • SETTING THE STAGE– “Poverty reduction must begin with children”. • CHILD POVERTY – from income to multi-dimensional definitions of child poverty • MDGS, CHILDHOOD, AND POVERTY – the nexus and implications • MDG PROGRESS IN SOUTH ASIA – ‘a tale of disparities’ • UNICEF ROSA INITIATIVES– linking the various initiatives under Policy advocacy and Partnerships for Children’s Rights
Key facts on South Asia • 1.5 billion people • 613 million under 18 - 41% • 175 million under 5 - 12% • Over 428 million under the international 1 USD/day at PPP poverty line, as per 2001 data • At least 10 million migrants Source: UNICEF ROSA, Statistical pocketbook 2008
Trends in income/consumption poverty in South Asia • Insignificant share of the world income - in 2004, South Asia accounted for 22.4% of global population, while its combined GNI was only 2.1% of the world income. • Significant variations in GNI – in 2004, GNI ranged between 675 billion US$ in India and 0.7 billion US$ in Bhutan • Second lowest GNI per capita at PPP, after Sub-Saharan Africa - in 2004, GNI per capita at PPP (incl. AFG) of 2,830 US$ compared to the world average of 8,760 US$; with Maldives at the top of the list. • Reduction in incidence of income / consumption poverty - measured by % of pop living on less than 1 USD/day at PPP, from 51.5% to 41.3% between 1981 and 1990, and further to 31.3% in 2001 (less AFG) Source: SAARC Regional Poverty Profile 2005
Regional income poverty Source: WB, Global Monitoring Report 2008
Incidence of poverty by country, % of pop. below international poverty line of 1 US$/day at PPP Source: SAARC Regional Poverty Profile 2005, please see report for footnotes and caveats
Incidence of poverty by country, % of pop. below national poverty line Source: SAARC Regional Poverty Profile 2005, please see report for footnotes and caveats
Regional inequality Source: WB, Global Monitoring Report 2008
Distribution of World Income Globalization for whom? Distribution of world GDP, 2000 (by quintiles, richest 20% top, poorest 20% bottom) Source: UNDP Development Report 2005
Historical Trend: Inequality Keeps Rising Ratio of the Income of the Richest 20% to the Poorest 20% Source: UNDP Human Development Reports 1999 and 2005, New York
‘INEQUALITY’ at Global Scale • Half of the world lives below the $2-a-day poverty line • Need to bring redistribu-tion to develop-ment agenda Source: Sutcliffe, 2005. Department of Economic and Social Affairs. WP 2. UNDESA
South Asia - Growth rate of GDP (% per year) Source: ADB Asian Development Outlook Report 2008
South Asia - Inequality by country, acc. to HDR 2007/08 Source: HDR 2007/08
Setting the stage – ‘poverty reduction begins with children’
“Poverty reduction must begin with children.” • Children hit the hardest by poverty – it causes lifelong damage to physical, emotional, spiritual growth and development • Poverty affects children disproportionately –– developing countries have a larger child population, and income-poor families generally have more children than wealthier families • Poverty is the cause of millions of preventable child deaths, hungry children, children missing school, exploited and abused children… Source: UNICEF Poverty Reduction Begins with Children2000, UNICEF SOWC Report 2005
“Poverty reduction must begin with children.” cont’d • Poverty in childhood is a root cause of poverty in adulthood – impoverished children often grow up to be impoverished parents who in turn bring up their children in poverty, cause a vicious poverty cycle • Well-being of children, future generations – a yardstick for measuring the wellbeing of nations • Economic prosperity at unprecedented levels – yet not every child has a good start in life • With less than a third of 1 percent of global income, all children could achieve a minimum standard of living! Source: UNICEF Poverty Reduction Begins with Children2000, UNICEF SOWC Report 2005
How is child poverty different from adult poverty? “I have to support my father as he cannot make much money to support our family,” Ramesh told IRIN in the Nepali capital, Kathmandu. The boy works 10 hours a day at a workshop in Kathmandu for US$15 per month. He quit school after migrating with his parents from Nawalparasi District, 200km southwest of Kathmandu, to escape hardship and poverty. “But life is more difficult here as we can’t afford to buy medicines and don’t have time to go to hospital,” said Ramesh. Source: IRIN 9 July 2007
Child poverty – from income-based to multi-dimensional definitions
“Policy debates have indeed been distorted by overemphasis on income poverty and income deprivation, to the neglect of deprivation that relates to other variables, such as unemployment, ill health, lack of education, and social exclusion.” Amartya Sen, Development as Freedom 1999
Definitions of child poverty UNICEF SOWC REPORT 2005 “Children living in poverty experience deprivation of the material, spiritual and emotional resources needed to survive, develop and thrive, leaving them unable to enjoy their rights, achieve their full potential or participate as full and equal members of society.”
Definitions of child poverty cont’d UN GENERAL ASSEMBLY 2007 “Children living in poverty are deprived of nutrition, water and sanitation facilities, access to basic health-care services, shelter, education, participation and protection, and that while a severe lack of goods and services hurts every human being, it is most threatening and harmful to children, leaving them unable to enjoy their rights, to reach their full potential and to participate as full members of the society”.
Key facts on child poverty and deprivation in South Asia – SOWC ‘08 • The largest absolute number of newborn deaths occurs in South Asia – India contributes a quarter of the world total. • South Asia has the highest level of under-nutrition – at 43% of children under 5 - among the regions. • South Asia has the second highest number of deaths among children under five, accounting for 32% of the global total. In 1990, 1 in every 8 South Asian children died before age five; by 2006, the ratio had decreased to 1 in 12. • Although sub-Saharan Africa has the highest proportion (66%) of children not registered at birth, South Asia, with a corresponding ratio of 64%, has the highest number of unregistered children. • South Asia has the highest rate of infants with low birth-weights, and the lowest rates of vitamin A supplementation. • Sub-Saharan Africa and South Asia together accounted for more than 80% of all child deaths in 2006.
Child Poverty by Region, 2000 Source: Source: Townsend Centre for International Policy Research, http://www.bristol.ac.uk/poverty/child%20poverty.html
MDGs, childhood, and poverty non-income Source: Table adapted from UNICEF SOWC Report 2005, p. 8-9, Data from various sources.
Prevalence of underweight (moderate and severe), 2000 - 2006 (Percentage of children under five years old whose weight for age is less than minus two standard deviations from the median for the international reference population ages 0-59 months) Note: Data refers to the most recent year available during the period specified. The boundaries and the names shown and the designations used on these maps do not imply official endorsement or acceptance by the United Nations. The dotted line represents approximately the Line of Control in Jammu and Kashmir agreed upon by India and Pakistan. The final status of Jammu and Kashmir has not yet been agreed upon by the parties. Source: UNICEF ROSA, South Asia Info database, 2008
Net enrolment ratio in primary education 2000-2004 Source: UNICEF ROSA, Progress and challenges in South Asia 2006, Kathmandu, 2006
Percentage of children of primary school age attending primary school by sex, location and wealth quintiles, Bangladesh 2006 100 Net Attendance Ratio Male Net AttendanceRatio Female Net AttendanceRatio Both sex 90 88 87 86 80 84 83 82 81 79 79 77 70 73 70 60 50 40 30 20 10 0 Urban Rural Lowest Highest Location Wealth quintile Source:: Bangladesh MICS 2006
Under-five mortality rate, 2000-2007 (The probability of dying between birth and the fifth birthday) Deaths per 1,000 live births for the five-year period preceding the survey. Note: Data refers to the most recent year available during the period specified. The boundaries and the names shown and the designations used on these maps do not imply official endorsement or acceptance by the United Nations. The dotted line represents approximately the Line of Control in Jammu and Kashmir agreed upon by India and Pakistan. The final status of Jammu and Kashmir has not yet been agreed upon by the parties. Source: UNICEF ROSA, South Asia Info database, 2008
Under-five mortality rate by sex, location and wealth quintile, Bangladesh 2004 & Nepal 2006 Deaths per 1,000 live births Bangladesh U5MR Nepal U5MR 120 121 100 102 98 98 92 91 88 80 84 80 78 72 60 61 47 47 40 20 0 Male Female Urban Rural Lowest Highest National quintile quintile Source:: Bangladesh DHS 2004, Dhaka 2005 Nepal DHS 2006, Kathmandu, 2007
Maternal mortality ratio Deaths per 100,000 live births (adjusted, 2005) 2000 1800 1800 1600 1400 1200 1000 830 800 570 600 450 440 400 320 200 120 58 0 Afghanistan Bangladesh Bhutan India Maldives Nepal Pakistan Sri Lanka Source: UNICEF ROSA, South Asia Info database, 2008
Births attended by skilled health personnel (Deliveries assisted by Doctor/Nurse/LHV/ANM/Other health personnel) Note: Data refers to the most recent year available during the period specified. The boundaries and the names shown and the designations used on these maps do not imply official endorsement or acceptance by the United Nations. The dotted line represents approximately the Line of Control in Jammu and Kashmir agreed upon by India and Pakistan. The final status of Jammu and Kashmir has not yet been agreed upon by the parties. Source: UNICEF ROSA, South Asia Info database, 2008
People living with HIV/AIDS Source UNAIDS / WHO 2007
Proportion of the population using improved drinking water sources 2001 - 2006 (Improved drinking water sources includes household water connection, public standpipe, borehole, protected dug well, protected spring, rainwater collection and bottled water) Note: Data refers to the most recent year available during the period specified. The boundaries and the names shown and the designations used on these maps do not imply official endorsement or acceptance by the United Nations. The dotted line represents approximately the Line of Control in Jammu and Kashmir agreed upon by India and Pakistan. The final status of Jammu and Kashmir has not yet been agreed upon by the parties. Source: UNICEF ROSA, South Asia Info database, 2008
Proportion of the population using improved sanitation facilities, 2001 - 2006 (Improved sanitation facilities include flush to piped sewer system, flush to septic tank, flush/pour flush to pit, flush/pour flush to elsewhere) Note: Data refers to the most recent year available during the period specified. The boundaries and the names shown and the designations used on these maps do not imply official endorsement or acceptance by the United Nations. The dotted line represents approximately the Line of Control in Jammu and Kashmir agreed upon by India and Pakistan. The final status of Jammu and Kashmir has not yet been agreed upon by the parties. Source: UNICEF ROSA, South Asia Info database, 2008
% of household population using improved sources of drinking water and using sanitary means of excreta disposal by location and wealth quintile, Bangladesh 2006 Urban 100 99 99 99 Rural 98 97 Lowest quintile 80 82 Highest quintile National 60 58 40 39 32 20 11 0 % of HH Population using sanitary means of excreta disposal % of HH Population using improved sources of drinking water Source: Bangladesh MICS 2006
Millennium Declaration – chapter VI on violence, exploitation and abuse Source: ILO, http://www.ilo.org/public/english/region/asro/newdelhi/ipec/responses/index.htm
ROSA initiatives and their value added in the context of the study on child poverty and disparities
ROSA initiatives and their value added • Broad approach to social policy including social exclusion, income inequality and related policy responses • Social protection as a form of social policy (Conceptual framework and symposium) • Social Budgets, Children and Society (Regional Fiscal Budget analysis – review of investments into social sectors and fiscal space to finance social policy) • Migration and Impacts on Children (review of impacts on child outcomes) • Capacity Development of Partners: CRC/CEDAW (SAARC Decade of the Rights of the Child), WFFC+ 5 (Regional Synthesis)
ROSA Initiatives and their value added • Strengthening the human rights and child rights principles • Identifying ways to make economic and social development more inclusive and equitable and pro-poor • Building stronger links between economic and social policies, and recognising the role of social policy and social protection for livelihoods, social inclusion, poverty reduction, and development • Better strategies to make legislation, policies and budgets more child-relevant • Better strategies to make social services more responsive to children and in particular vulnerable children and socially excluded groups • Using social policy to accelerate MDG achievement
NEPAL/ROSA: a universal child grant as a building block for a broader Social Protection Strategy • One example from recent practice • Technical and advocacy partnership with ILO Geneva and Nepal • Influencing Planning Commission, Ministry of Finance, Ministry of Local Development, Ministry of Labour • Rationale: • rights-based • economic revival • political healing • A survey of the interests of potential beneficiaries underway with WFP • Possibly pilot in one disadvantaged area of Nepal DfID and World Bank interested
Social Protection Symposium: Some policy ideas and outcomes • Portability of rights to basic social services - Looking at “mobile” forms of social protection across state and country borders and at the right to social protection for migrants • Idea of a tri-fold approach, combining • Enhanced, inclusive social services delivery (education, health, water and sanitation, etc.) • Cash transfers to households to improve economic security • Provision of trained and salaried care services by government or non-profit sector- recognising the “care economy” • The need for inclusiveness in social protection • The case for a citizens’ or social compact for social protection • Case for a “generative” or transformative social protection model embracing a plurality of models • Consensus on the shift towards universalising social protection • Emphasise the need for a child-sensitive social protection which prioritises the key rights and development needs of children • Seizing opportunities from economic growth and political change in South Asia • Advocacy for a global social floor or minimum social protection among UN agencies (ILO, DESA, UNICEF, UN-ESCAP) and regional partners (SAARC)
ROSA: Fiscal budget analysis across 8 countries of South Asia Observation: Rapid economic growth in South Asia has created a strategic opportunity to advocate for larger (and more effective) social expenditures Outcomes: • Devinfo database at ROSA to include countries’ fiscal budget data • Use as analytical and advocacy tool at country and regional level • examples of applications: Afghanistan, Nepal, Maldives, Pakistan
100% 8.10 8.84 10.38 16.93 17.22 90% 21.81 9.63 14.74 37.27 80% 17.04 24.19 70% 25.21 41.96 16.34 60% 45.18 22.54 16.61 50% 18.35 40% 20.16 17.65 60.08 30% 8.24 57.07 43.49 40.23 20% 28.48 27.51 24.77 10% 0% BGD BTN IND MDV NPL LKA AVG Education as % social expenditure Housing & Community Amenities as % social expenditure Health as % social expenditure Social Exp as % total expenditure Social Security & Welfare as % social expenditure Social expenditure - sectoral allocation Year 2005 Source: UNICEF ROSA, South Asia Fiscal Budget database, 2008