Download
1 / 45
460 likes | 666 Vues
Chapter 19 Notes. Mrs. Sealy. Types and Sources of Water Pollution. Water Pollution = any chemical, biological or physical change in water quality that has a harmful effect on living organisms or makes water unsuitable for desired use. Major Types of Water Pollution.

E N D
Chapter 19 Notes Mrs. Sealy
Types and Sources of Water Pollution • Water Pollution = any chemical, biological or physical change in water quality that has a harmful effect on living organisms or makes water unsuitable for desired use
Major Types of Water Pollution • Disease causing agents (pathogens) – bacteria, viruses, protozoa, and parasitic worms that come from sewage and untreated human and animal waste • Indicator of water quality = # colonies coliform bacteria • 0-100=drinking water, max of 200 for swimming water
Oxygen Demanding Waste • Organic wastes that can be decomposed by aerobic bacteria. Bacteria deplete water of oxygen, which causes death to fish and other aerobic aquatic life • BOD = biological oxygen demand = amount of oxygen needed by aerobic decomposers to break down organic matter in a certain volume of water over a five day period at twenty degrees Celsius
Water Soluble Inorganic Chemicals • Acids, salts, and compounds of toxic metals (Hg, Pb) • High levels of these make water unfit to drink, harm fish, and other aquatic life, lower crop yields and accelerates metal corrosion
Inorganic Plant Nutrients • Water soluble nitrates and phosphates that cause excessive growth of algae and other aquatic plants, which die, decay and deplete water of oxygen, killing fish. • Excessive levels of nitrates lower the oxygen carrying capacity of blood causing “Blue Baby Syndrome”
Organic Chemcials • Oil, plastic, gas, pesticides, solvents, and detergents • Threaten human fish and aquatic life • Just downright poisonous
Sediment or suspended matter • Clouds the water and reduces photosynthesis, which disrupts food webs and carries bacteria and pesticides • It clogs and fills lakes, streams and harbors • Decreases the efficiency of chlorine to disinfect water
Water Soluble Radioactive Isoptopes • Can be biologically magnified in tissues and organs • Ionizing radiation can cause birth defects, cancer and genetic damage
Thermal Pollution • Heat absorbed by water to cool industrial and power plants which lowers the water quality by lowering dissolved oxugen leels making aquatic organisms more vulnerable to disease, parasites and toxic chemcials • Causes fish kills • Increases the growth rate of algae Finland
Genetic Pollution • When aquatic ecosystems are disruoted by deliberate or accidental introduction of non-native species, which reduces biodiversity and causes economic loss. • These species are usually introduced in the ballast water of ships
Point source Pollution • 1. Point sources = discharge pollutants at specific locations (pipes, ditches, & sewers at factories, sewage treatment plants, active and abandoned underground mines, offshore oil wells, & oil tankers). These are controlled in developed countries and uncontrolled in developing countries.
Non-point Source • 2. Non Point Sources = pollutants that cannot be traced to a specific site. These include large land areas that pollute due to runoff, subsurface flow, & deposition from the atmosphere. Agriculture produces non-point pollution in the form of sediment, inorganic fertilizers, manure, salts dissolved in irrigation water and pesticides.
II. Pollution Of Streams and Lakes • A. Stream and River Pollution • 1. Streams and rivers usually recover rapidly as long as streams are not overloaded with pollutants and flow is not reduced due to drought, damming, or diversion for agriculture and industry
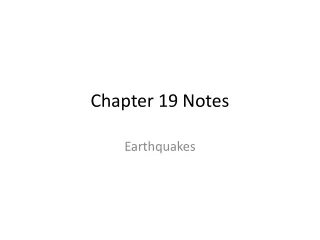
II. Pollution Of Streams and Lakes • Oxygen Sag Curve = when bacteria reduces or eliminates populations of organisms with high oxygen requirements. This depends upon stream volume, flow rate, temperature, pH level and volume of degradable wastes. This curve can also be done for thermal pollution
Clean Zone Decomposition Zone Septic Zone Recovery Zone Clean Zone Normal clean water organisms (Trout, perch, bass, mayfly, stonefly) Trash fish (carp, gar, Leeches) Fish absent, fungi, Sludge worms, bacteria (anaerobic) Trash fish (carp, gar, Leeches) Normal clean water organisms (Trout, perch, bass, mayfly, stonefly) Types of organisms 8 ppm 8 ppm Dissolved oxygen Oxygen sag Concentration Biological oxygen demand 2 ppm Direction of flow Point of waste or heat discharge Time of distance downstream Fig. 19.3, p. 479
Reduction of Stream Pollution • require cities to withdraw drinking water downstream rather than upstream, which improves water quality • Water pollution laws of 1970 have increased the number and quality of wastewater treatment plants which in the US and other developed countries has reduced or eliminated point source pollution
Lake Pollution • Dilution is less effective • Lakes and reservoirs contain stratified layers that undergo little vertical mixing. Stratification reduces levels of dissolved oxygen (especially on the bottom) • Ponds contain small volumes of water • Lakes are more vulnerable to contamination by plant nutrients, oil, pesticides, and toxic substances (Pb,Hg,Se) and acid deposition
Water 0.000002 ppm Herring gull 124 ppm Phytoplankton 0.0025 ppm Herring gull eggs 124 ppm Lake trout 4.83 ppm Zooplankton 0.123ppm Rainbow smelt 1.04 ppm Fig. 19.4, p. 481
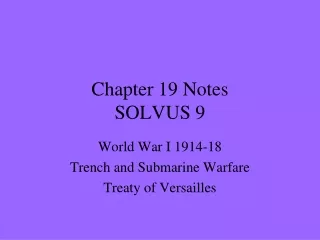
Eutrophication • Natural nutrient enrichment • Cultural Eutrophication=when human activities near urban or cultural areas greatly accelerate the input of nutrients to a lake. Mostly nitrates and phosphates cause this.
Eutrophication • During hot weather, dense growths of algae, cyanobacteria, duckweed and hyacinths occur and dissolved oxygen is depleted which kills fish and other aquatic animals • Excessive nutrients can cause anaerobic bactria to take over and produce gaseous decomposition products (CH4, H2S)
Discharge of untreated municipal sewage (nitrates and phosphates) Nitrogen compounds produced by cars and factories Natural runoff (nitrates and phosphates Discharge of detergents ( phosphates) Manure runoff From feedlots (nitrates and Phosphates, ammonia) Discharge of treated municipal sewage (primary and secondary treatment: nitrates and phosphates) Runoff from streets, lawns, and construction lots (nitrates and phosphates) Lake ecosystem nutrient overload and breakdown of chemical cycling Runoff and erosion (from from cultivation, mining, construction, and poor land use) Dissolving of nitrogen oxides (from internal combustion engines and furnaces) Fig. 19.5, p. 482
CANADA Nipigon Bay Jackfish Bay Thunder Bay Silver Bay St. Mary’s R. St. Lawrence R. Spanish R. St. Louis R. MICHIGAN Penetary Bay Sturgeon Bay WISCONSIN MICHIGAN Saginaw Bay NEW YORK Niagara Falls Saginaw R. System Grand R. MINNESOTA Niagara R. St. Clair R. Thames R. Buffalo R. Detroit R. Rouge R. Raisin R. Ashtabula R. PENNSYLVANIA IOWA Cuyahoga R. Maumee R. Rocky R. Black R. ILLINOIS INDIANA OHIO Great Lakes drainage basin Most polluted areas, according to the Great Lakes Water Quality Board “Hot spots” of toxic concentrations in water and sediments Eutrophic areas Fig. 19.7, p. 484
Industrial pollution Suffocated fish Beaches closed Sewage runoff Dead algae Low dissolved oxygen Decreased fish population Mercury- tainted fish Fig. 19.8a, p. 485
Suburban sprawl Lower water levels Clear water High dissolved oxygen PCB’s in sediment Thriving fish population Fig. 19.8b, p. 485
Ways To Prevent Cultural Eutrophication • Use advanced sewage treatment • Ban or limit phosphates in household detergents and other cleaners • Practice soil conservation and land use control to reduce nutrient runoff
Ocean Hypoxia • The “Dead Zone” is an area of the ocean that is severely oxygen depleted due to cultural eutrophication • Caused by plant nutrients that get washed down rivers into the ocean causing algal blooms and fish kills • Examples: Chesapeake bay and the Gulf of Mexico
Ocean Pollution • How coastal areas are effected 1. wetlands, estuaries, coral reefs, mangrove swamps bear the majority of the enormous wastes we ad to the ocean 2. Most sewage in developing countries is dumped directly into the ocean without treatment * sewage and agricultural wastes introduce large quantities of nitrogen and phosphorus to the water which causes algal blooms
Ocean Pollution • Pollutants that are dumped into the ocean: 1. dredge spoils or materials full of toxic chemicals scraped from the bottom of harbors and rivers to maintain channels are dumped from barges and ships at 110 sites in the Pacific, Atlantic and Gulf Coasts 2. sewage sludge-gooey, mud like mixture of toxic chemicals, infectious agents and settled solids removed from wastewater at sewage treatment plants (banned in the US since 1992)
Ocean Pollution • Sewage and garbage from merchant marine fleets • Highly toxic pollutants and high level radioactive wastes
Ocean Pollution • Effects of oil on ocean ecosystems • Crude petroleum (oil from ground) and refined petroleum (fuel oil, gasoline, & other petroleum products) pollution comes from normal operation of offshore wells, washing tankers, & releasing oily water and from pipeline and storage tank leaks onto the land or into sewers by cities, individuals and industry (1000X’s that spilled by the Exxon Valdez).
Ocean Pollution • Tar like globs that float on the surface coat feathers of diving and other birds and the fur of marine mammals, which destroys their insulation and buoyancy, which causes death due to the loss of body heat. • Oil that sinks to the bottom smothers bottom dwelling organisms (crabs, oysters, mussels, clams) and can kill coral reefs. • Overall- it is a low risk ecological problem.
Prevention of Ocean Pollution • Reduce oil waste and shift to renewable energy resourcesReduce flow of pollution from the land & streams into the oceans. • Prevent and control air pollution (33% of pollutants come from emissions). • Prevention • Discourage sludge dumping and hazardous dredged material. • Reduce or curtail development of oil drilling and oil shipping in coastal areas. • Develop land use planning in coastal areas. • Require double hulls in oil tankers by 2002. • Recycle used oil • Reduce genetic pollution in ballast water.
Prevention and Reduction of Surface Water Pollution • Nonpoint pollution • 1.Leading cause=agriculture. Farmers can reduce fertilizer runoff onto surface waters and into aquifers by:. • Reducing or eliminating the amount of fertilizer use. • Use slow release fertilizers. • Alternate crops between row crops and nitrogen fixation crops • Plant buffer zones between cultivated fields and nearby surface waters. • Apply pesticides only when needed. • Use biological controls for pests.
Prevention and Reduction of Surface Water Pollution • Eliminate or reduce inorganic fertilizers and pesticides for golf courses, lawns and public lands. • Livestock growers could manage animal density (reducing manure). Planting buffers, and locating feed lots. • Create detention basins for animal runoff and reapply fertilizers to croplands or forestlands. • Reforest critical watersheds (reduces soil erosion and the severity of flooding and slows global warming and the loss of wildlife habitants.
Point Pollution and the Legal Approach • 2% of the sewage is treated in Latin American, 15% in China, and 30% in India The Clean Water Act of 1977 and the Water Quality Act of 1987 form the basis of the U.S. effort to control pollution of the country’s surface waters. • The main goal=safe waters for fishing and swimming by 1983 and restore and maintain chemical, physical, and the biological integrity of the nation’s waters. • Discharge Trading Policy of 1995 uses market forces to reduce water pollution. Credits can be sold for excess reductions- like air pollution control and SO.
Sewage Treatment Plants • Primary sewage treatment= a mechanical process to screen out debris (sticks, stones, rages, etc.), and suspended solids which settle out as sludge in a settling tank.
Sewage Treatment Plants • Secondary sewage treatment= biological process in which aerobic bacteria are used to remove up to 90% of biodegradable, oxygen demanding organic wastes. • Trickling filters= aerobic bacteria degrade sewage as it seeps through a bed of crushed stones covered which bacteria and protozoa. • Activated sludge process=sewage is pumped into a large tank, mixed for hours with bacteria and air to facilitate degradation by microorganisms. Then suspended solids settle out as sludge. • Sludge from both primary and secondary treatment is broken down in an anaerobic digester and then incinerated, dumped into the ocean, or used as fertilizer.
Sewage Treatment Plants • Advanced Sewage Treatment= series of chemical and physical processes that remove pollutants left in the water after primary and secondary treatment. • Advanced sewage treatment removes nitrates and phosphates which contribute to eutrophication of lakes, slow moving streams, and coastal waters. • These advanced plants cost twice as much to build and four times as much to operate. Water from primary, secondary, and advanced treatment plants is bleached and disinfected by chlorinating. • Sewage Sludge (36% by weight) is applied to farmland as fertilizer for crops used for animal feed and human food. • 38% is dumped into landfills;16% is incinerated; 9% is composted
Waste lagoon, pond, or basin Hazardous waste injection well Mining site Water pumping well Buried gasoline and solvent tanks Pumping well Road salt Sewer Landfill Cesspoll, septic tank Leakage from faulty casing Unconfined freshwater aquifer Groundwater Confined freshwater aquifer Groundwater flow Discharge Confined aquifer Fig. 19.9, p. 487
Groundwater • IV. Groundwater = prime source of drinking water and irrigation water. Groundwater cannot cleanse itself like surface water does. • Reasons for pollution • groundwater flow is slow, not turbulent • contaminants are not effectively diluted and dispersed • groundwater has smaller proportions of decomposing bacteria • cold temperatures slow decomposition
Groundwater • Reasons for Pollution • underground storage tanks • landfills • abandoned waste dumps • deep well disposal of liquid hazardous waste • industrial and livestock waste storage lagoons located near aquifers • industrial waste ponds without liners to prevent toxic liquid wastes from seeping into aquifers
VI. Drinking Water Quality • Protection of drinking water • U>S> Safe Drinking Water Act of 1974 tests fro 64 contaminants • Strengthening Safe water Act: • improving water treatment by combining smaller water systems for larger ones • strengthening and enforcing public notification requirements about violations • banning all lead in new plumbing pipes, faucets and fixtures
Bottled Water • International Bottled Water Association tests for 181 contaminants • National Sanitation Foundation = certification by this agency requires tests for 200 chemical and biological contaminants • EPA does not test or approve water-filtering devices • One/fourth of it is tap water • 40% is contaminated by bacteria and fungi • 1.5 million tons of plastic thrown away • Oil used to make plastic would power 100,000 cars for a year.