Download
1 / 30
300 likes | 307 Vues
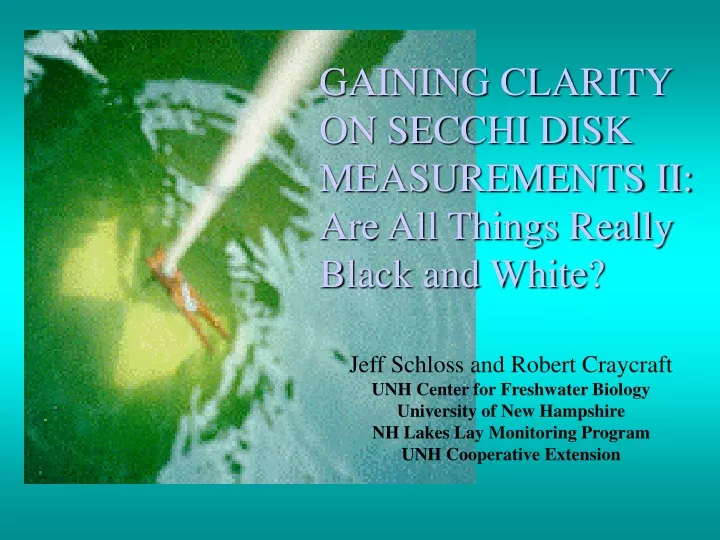
GAINING CLARITY ON SECCHI DISK MEASUREMENTS II: Are All Things Really Black and White?. Jeff Schloss and Robert Craycraft UNH Center for Freshwater Biology University of New Hampshire NH Lakes Lay Monitoring Program UNH Cooperative Extension. Limnological SD Black & White 20 cm (8”).

E N D
GAINING CLARITY ON SECCHI DISK MEASUREMENTS II: Are All Things Really Black and White? Jeff Schloss and Robert Craycraft UNH Center for Freshwater Biology University of New Hampshire NH Lakes Lay Monitoring Program UNH Cooperative Extension
Limnological SD Black & White 20 cm (8”) Oceanographic SD All white 40-60 cm
Water Clarity(Secchi Disk Depth) Absorption & Scattering of Light by Sediment Algae Detritus Dissolved Color
No Standard Method! • Shady Side vs Sunny Side? • Depth of Disappearance/Reappearance? • View Scope or Not? • Time of Day? • Sun Directly Overhead (Welch 1948) • 10 am to 2 pm (Cole 1982) • 9 am to 3 pm (Lind 1968) • 10 am to 4 pm (Michigan) • see Verschuur (Lake and Res. Mngmt 1997)
UNH CENTER FOR FRESHWATER BIOLOGY LAKES LAY MONITORING PROGRAM
Table 1: Secchi Disk Transparency Study Weather Data. Recorded water/sky conditions STUDY DETAILS • 1996-1999 Data set for Volunteers and Professionals • May - October sampling • Average depth of disk disappearance and re-appearance Shady side with and without view-scope Sunny side with or without view-scope Replicate readings recorded
Analysis • What is the reproducibility (precision) using different protocols? • How comparable are the protocols? • What effect do reflection and surface condition have on precision and comparability?
PERCENT VOLUNTEER READINGSEXCEEDING 10% PRECISION PERCENT (%)
PERCENT PROFESSIONAL READINGSEXCEEDING 10% PRECISION PERCENT (%)
All Complete Paired Data N=644 1996-1999 Volunteer Monitoring Data Without Scope With Scope max 75% 25% min
Shadow Interference Sunny Side Shady Side Reflection & Scatter
CLEAR SKY CLOUDY SKY
SUMMARY I • Overall precision by volunteer monitors was excellent compared to professionals (1%-3%). • Less outliers when viewscope was used. • Higher sensitivity of measurement with scope in clear lakes especially SD >10m. • Interference increased as the lake surface became more rough or reflective (>15-20%) especially for SD > 6m (both treatments).
Enter the Black Disk…….. Davies-Colley (1988 Limnol Ocean.)
Comparative Precision 2003 – 2005 UNH CFB Surveys, N= 160
BD SD Secchi Disk vs Black Disk R-square = 0.829 BD = 0.52 * SD + 0.19
Surrogate Regression Results I >= 20 ptu; 10m SD N=61; 1999 50 Lake Study
Surrogate Regression Results II N=149; 2002-2005 CFB Surveys
Summer Temperature Stratification Epilimnion= warm mixed layer Metalimnion or Thermocline Hypolimnion =cold bottom water Temperature oC 16 12 24 8 20
Residuals for 1/SD Solar Time Sun Angle (Degrees)
How does SD compare to optical measurements? Extinction Coefficient is measured with an underwater light meter (irradiometer). It represents the decrease in light with depth. -kz I = Io e where: I= Light level at depth z Io=Light at surface e= exponential k= Extinction coefficient z=depth k= 0.0112 + 2.989*1/SD R-Sq = 0.853 N=61; 1999 50 Lake Study
SUMMARY II • The vertical black disk measurements were more difficult to make and less precise than SD. However precision, was still very good overall. • Black disk reading were a little over 2x the SD reading. • Black disk readings correlated slightly better to CHL while SD readings did the same with Color; SD regressed stronger in the multiple regessions. • Neither Sun Angle nor Solar Time seemed to impact the surrogate regressions nor the BD to SD relationship. • Residual Analysis suggests that disk readings near the metalimnion may be affected