Download
1 / 56
560 likes | 678 Vues
Iodine Deficiency Disorders. ศาสตราจารย์นายแพทย์รัชตะ รัชตะนาวิน และคณะ คณะแพทยศาสตร์โรงพยาบาลรามาธิบดี มหาวิทยาลัยมหิดล. บูรณาการงานวิจัยเพื่อพัฒนาประเทศ มหาวิทยาลัยเกษตรศาสตร์. 10 ตุลาคม 2548. I. I. COOH. O. CH 2. CH. OH. NH 2. I. I. Thyroxine (T 4 ). I. I. COOH. O. CH 2.

E N D
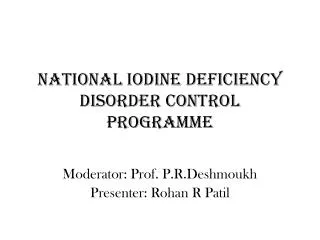
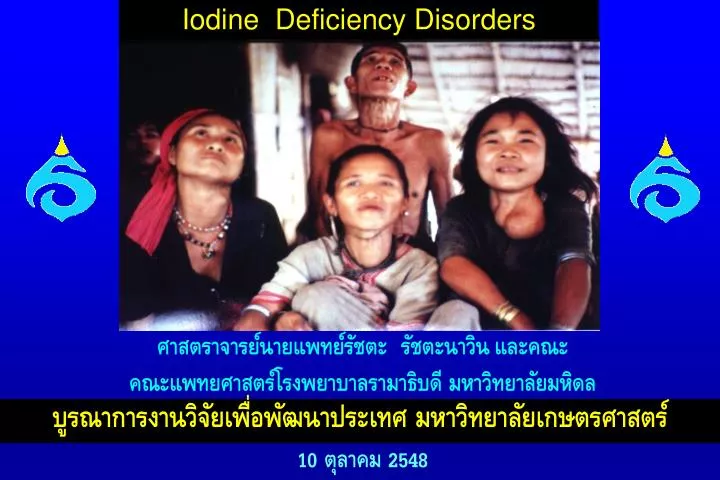
Iodine Deficiency Disorders ศาสตราจารย์นายแพทย์รัชตะ รัชตะนาวินและคณะ คณะแพทยศาสตร์โรงพยาบาลรามาธิบดี มหาวิทยาลัยมหิดล บูรณาการงานวิจัยเพื่อพัฒนาประเทศ มหาวิทยาลัยเกษตรศาสตร์ 10 ตุลาคม 2548
I I COOH O CH2 CH OH NH2 I I Thyroxine (T4) I I COOH O CH2 CH OH NH2 Thyroid Hormone I Triiodothyronine (T3)
Maternal T4 Fetal T4 Neonatal T4 Thyroxine-Dependent-Human Brain Development PHASE I PHASE II PHASE III 0 12 wks birth 1 yr 0 12 wks birth 1 yr Cerebral neurogenesis & migration Neuronal differentiation, Axonal outgrowth, Dendritic ontogeny, synaptosis, Cerebellar neurogenesis, Gliogenesis Myelinogenesis
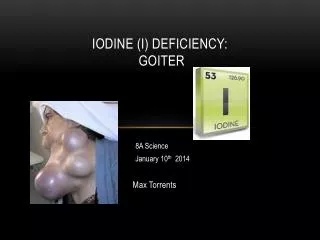
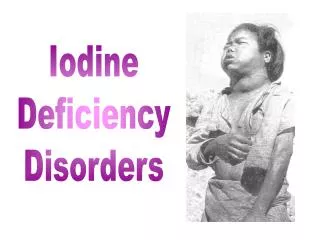
The Consequences of IDD • Cretinism • Cognitive and psychomotor deficiency • Hypothyroidism • Childhood mortality • Reproductive failure • Goiter Socioeconomic retardation
Status of Iodine Nutrition in Thailand Division of Nutrition Department of Health:MOPH 2004 N = 55 provinces
20 15 number of provinces 10 5 0 North North - Central South East N = 55 provinces Adequate iodine Inadequate iodine Division of Nutrition Department of Health: MOPH 2004 Excessive iodine
20 15 number of provinces 10 5 0 North North - Central South East N = 55 provinces Adequate iodine Inadequate iodine Division of Nutrition Department of Health: MOPH 2004 Excessive iodine
คะแนนเฉลี่ยและค่าเบี่ยงเบนมาตรฐานของระดับเชาวน์ปัญญาเด็กวัยเรียนคะแนนเฉลี่ยและค่าเบี่ยงเบนมาตรฐานของระดับเชาวน์ปัญญาเด็กวัยเรียน ภาค กรุงเทพฯ กลาง เหนือ อีสาน ใต้ การสำรวจภาวะ 96.5 92.3 87.9 89.7 94.7 91.9 สุขภาพ ครั้งที่ 2 (+13.7) (+13.2) (+15.9) (+14.6) (+14.5) (+14.8) (2539-2540) การศึกษาครั้งนี้ 94.6 88.8 84.2 85.9 88.1 88.0 (2545) (+14.2) (+12.0) (+10.7) (+11.1) (+12.9) (+12.6) การศึกษา (ปี พ.ศ.) รวมทั้ง ประเทศ นิชรา เรืองดารกานนท์ พัฒนาการและเชาวน์ปัญญาของเด็กไทย, 2547
Osteoporosis in Thailand What have we learned? ศาสตราจารย์นายแพทย์รัชตะ รัชตะนาวิน และคณะ คณะแพทยศาสตร์ โรงพยาบาลรามาธิบดี มหาวิทยาลัยมหิดล บูรณาการงานวิจัยเพื่อพัฒนาประเทศ มหาวิทยาลัยเกษตรศาสตร์ 10ตุลาคม 2548
Bone loss during adult life Men -20 to –30% • Premenopause • slight bone loss • Postmenopause • accelerated bone loss • Old age • slowing of bone loss Bone density Women -35 to –50% 40 60 80 Age (year)
Peak bone mass v.s. Rate of bone loss Effect of peak bone mass Effect of rate of bone loss Bone mass Bone mass Menopause Menopause Postmenopause Postmenopause Health Council on Osteoporosis
NormalTrabeculae bone OsteoporoticTrabeculae bone
Osteoporosis Common sites of fracture Definition A systemic skeletal disease characterized by low bone mass and microarchitectural deterioration if bone tissue, with a consequent increase in bone fragility and susceptibility to fracture Spine Hip Wrist Consensus Development Conference. Am J Med 1993;94:646-50
Pathophysiology of Osteoporosis Low peak bone mass Aging Low BMD Heredity Menopause Increased bone loss Fractures Trauma Sporadic factors
Sporadic factors • Calcium intake • Physical activity • Vitamin D level • Addictions • Alcohol consumption • Smoking • Drugs • Steroid • Other diseases • Cerebrovascular disease • Thalassemia • Distal renal tubular acidosis
Clinical Burden of Osteoporosis • Fracture • Cosmetic deformity • Restricted mobility • Pain • Increased mortality
Medical, Nursing Home and Social Costs of Osteoporotic Fractures $ $ 60 billion $ 30 billion $ 15 billion $ 1995 2020 National Osteoporosis Foundation, 1993; Ray NF et al. J Bone Miner Res 1997;12:24-35
Annual Costs of Various Chronic Diseases Ray NF et al. J Bone Miner Res 1997;12:24-35; DHHS pub no PHS 92-1774; Irwin et al. Battelle Med Tech Assess Pol Res Cen 1992; Weiss et al. N Engl J Med 1992;326:862
Age-adjusted incidence (per 100,000) Age (yrs) • Phadungkiat S, et al • J Med Assoc Thai 2002;85:565
Risk factors for hip fracture in Asian Risk factor RR (95 % CI) men women Dietary calcium intake Lowest three quartiles (<498 mg/day) 1.5(1.0-2.2) 2.0(1.5-2.8) Load-bearing activity in immediate past Every day 1.0 1.0 Weekly 1.2(0.7-2.1) 1.1(0.7-1.7) None 3.4(2.3-5.1) 2.0(1.4-2.7) No vigorous sports 2.4(1.6-3.6) 7.2(4.0-13.0) at 25-49 yr Alcohol drinking 7 days a week 1.9(1.1-3.2) 2.9(1.0-8.6) Ex or current smoker 1.5(1.0-2.1) - Asian Osteoporosis Study : Malaysia, Philippines, Singapore, Thailand Lau EMC, et al J Bone Miner Res 2001;16:572-80.
Median319 mg Mean361mg Mode206 mg Person Calcium intake (mg/d) Komindr S, 1994
Bone mineral density by age 1.6 .9 1.4 .8 1.2 .7 1.0 .6 L2_4BMD (g/cm2) R33BMD (g/cm2) .8 .5 .6 .4 .4 .3 9 10 11 12 13 14 15 16 17 18 9 10 11 12 13 14 15 16 17 18 Age (y) Age (y) 1.6 .5 1.4 .4 1.2 FNBMD (g/cm2) 1.0 .3 SEX RUD_BMD (g/cm2) .8 male .2 .6 .4 .1 female 9 10 11 12 13 14 15 16 17 18 9 10 11 12 13 14 15 16 17 18 Age (y) Age (y) Suthutvoravut, et al. 1999
Percentage of increment in total BMD between groups after 1 year of Ca supplementation P = .033 P = .007 Percentage of increments (%) Charoenkiatkul, et al. 1999
Effect of increased physical activity on BMD increment in girls b 8 7 . 7 7 b 6 5 . 9 BMD increment (%) b 5 a a 4 . 7 4 . 5 4 4 . 3 3 . 8 3 3 . 3 3 . 2 3 . 2 2 2 . 3 1 a P<0.05; b P<0.005; intervention control Spine BMD Femoral neck BMD Femoral shaft BMD Mid shaft BMD Distal radius BMD Suthutvoravut et al, 2003
Independent determinants of bone mineral density Lumbar spine Femoral neck Distal radius Factor BMD BMD BMD Age (per 1 year) -0.008 + 0.001** -0.008 + 0.001** -0.003 + 0 .0004** Ca intake (log g/d) 0.018 + 0.002** 0.029 + 0.015 0.007 + 0.007 Energy expenditure 0.181 + 0.050** 0.129 + 0.037** 0.047 + 0.015* (log kcal/d) R2 0.35 0.45 0.42 *p = 0.01 **p = 0.0001 Pongchaiyakul C, et al Osteoporosis Int 2005:in press
25-hydroxyl vitamin D levels in Americans Sharla SH, Scheidt - Nave C. Clin Lab 1996;42:475-7
R = 0.24 P < 0.05 R = 0.36 P < 0.01 Chailurkit et al 1994
men * * * * * 25 hydroxy vitamin D (ng/ml) women Age (years) • P < 0.05 v.s. women at the same group • Chailurkit L, et al • J Med Assoc Thai 2001;84:1175
Serum 25-hydroxyvitamin D Level and Age = Normal Range Krauwit A, et al 2005
+ Environment Genes
Vitamin D Receptor Genotype Distribution Thais Japanese Caucasians
VDR Gene Polymorphism and Change in Urinary Calcium after Oral Calcium Change in Urinary Ca (%) P < 0.001 NS Ongphiphadhanakul B, et al. J Endocrinol Invest. 1997; 20:592-6
Haplotypes and Prevalence of Osteoporosis in Women Aged 65 Years or Older OP 12 % Non - OP 88 % 19 Others 139 96 % OP P < 0.001 67 % GA / AA AA / CC 1 4 1 % 3 % Non - OP 33 % Ongphiphadhanakul B, et al Osteoporos Int 2001;12:1015
40-44 45-49 50-54 55-59 60-64 65-69 70-74 75-79 80-84 85-89 90-94 0 1 2 3 4 5 6 7 8 9 40-44 -1 0 1 2 3 4 5 6 7 8 9 45-49 -2 -1 0 1 2 3 4 5 6 7 8 50-54 -3 -2 -1 0 1 2 3 4 5 6 7 55-59 -4 -3 -2 -1 0 1 2 3 4 5 6 60-64 -5 -4 -3 -2 -1 0 1 2 3 4 5 65-69 -6 -5 -4 -3 -2 -1 0 1 2 3 4 70-74 -7 -6 -5 -4 -3 -2 -1 0 1 2 3 75-79 -8 -7 -6 -5 -4 -3 -2 -1 0 1 2 80-84 -9 -8 -7 -6 -5 -4 -3 -2 -1 0 1 85-89 -10 -9 -8 -7 -6 -5 -4 -3 -2 -1 0 90-94 -10 -9 -8 -7 -6 -5 -4 -3 -2 -1 95-99 The Osteoporosis Self-assessment Tool for Asians Weight (kg) 10 LOW RISK probability ~3%: delay BMD Age (yr) AT RISK probability ~15%: consider BMD (If currently on HRT, probability ~3%: delay BMD) HIGH RISK probability ~61%: BMD & treat -11 Koh LKH, et al Osteoporos Int 2001;12:699.
Performace of OSTA Index: Effect of ERα Genotype Asian population Subjects with AA genotype Index value % with osteoporosis % with osteoporosis < -4 61 100 -1 to -4 15 60 > -1 3 8.3 Ongphiphadhanakul B, et al Osteoporosis Int 2003;14:863
Age Recommended daily calcium intake (mg) Infant 0-5 months 210 6-11 months 270 Children 1-3 years 500 4-8 years 800 Adolescent 9-18 years 1000 Adult 19-50 years 800 >50 years 1000 Pregnant women 800 Lactating women 800
54.8 mg/5 g 3440 mg/stick 610 mg/piece 317.9 mg/circle 191.3 mg/circle 505.4 mg/stick 78 mg/piece