Download
1 / 21
210 likes | 339 Vues
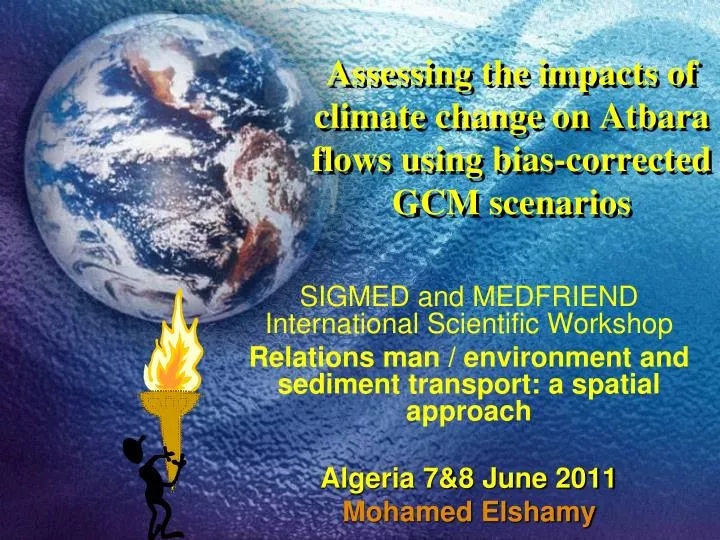
Assessing the impacts of climate change on Atbara flows using bias-corrected GCM scenarios. SIGMED and MEDFRIEND International Scientific Workshop Relations man / environment and sediment transport: a spatial approach Algeria 7&8 June 2011 Mohamed Elshamy. Outline. 1. Uncertainty Cascade.

E N D
Assessing the impacts of climate change on Atbara flows using bias-corrected GCM scenarios SIGMED and MEDFRIEND International ScientificWorkshop Relations man / environment and sediment transport: a spatial approach Algeria 7&8 June 2011 Mohamed Elshamy
Outline 1. Uncertainty Cascade 2. The Nile Basin & Previous CC studies 3. Study Area & Methodology 4. Results 5. Conclusions
Uncertainty Cascade Emissions Concentrations Radiative Forcing Global Climate Models Regional Details (Downscaling) Observations Impact Models (e.g. Hydrology)
The Nile Basin • Large area (2.9 x 10⁶ km2) • Low specific discharge • Spans several climate regions • Variable topography • High runoff variability • High Sensitivity to Climate
Previous Studies (1) • 6 Transient scenarios (3 GCMs x 2 Emission Scenarios) • Statistically downscaled using a spatio-temporal weather generator • Changes at Dongola from 2010-2100 Lake Nasser Flood & Drought Control Project (2008) Elshamy, M.E., Sayed, M.A.-A. and Badwy, B., 2009. Impacts of climate change on Nile flows at Dongola using statistically downscaled GCM scenarios. Nile Water Science & Engineering Magazine 2: 1-14
Previous Studies (2) Elshamy et al. (2009) • 17 GCMs x A1B scenario • Statistically downscaled using Bias Correction Method • Blue Nile Flow Changes: -60% to +45% Elshamy, M.E., Seierstad, I.A. and Sorteberg, A., 2009. Impacts of climate change on Blue Nile flows using bias-corrected GCM scenarios. Hydrol. Earth Syst. Sci., 13(5): 551-565.
The Atbara Basin Climate: Semi-Arid/Arid Area:200 000 km2 Mean Rainfall: 500 mm/yr Mean PET: 1730 mm/yr Mean Flow: 8.5 BCM/yr (1961-1990) Very Sensitive to Climate
Methodology Coarse Daily GCM Rainfall Bias Correction Downscaling Fine-Scale Daily Rainfall Compatible PET Scenarios Hydrological Model Flow at Atbara 17 GCMs x 1 Scenario
Bias Correction Downscaling • Bias correction for downscaling rainfall (based on fitting the gamma distribution to daily rainfall) • Simple bias correction for PET (ratio) • NFS & HBV for hydrological modeling • An ensemble approach (17 GCMs – A1B) • Baseline 1961-90, Future 2081-2098, Daily rainfall data & Monthly PET data
Satellite Images Rain gauge Data Rainfall Estimation Models Rainfall Estimates Historical Climate Water Balance Hydrological Models Hill Slope GIS Routing Simulation and Extended Stream Flow Prediction (ESP) Swamp Lake Nile Forecast System (NFS)
HBV Hydrological Model From soil moisture routine Precipitation on lakes dUZ P Lake evaporation UPPER ZONE EA=EPOT UZ Water balance equation, upper zone: KUZ1 Q11 d UZ = dUZ - PERC - Q11 - Q10 UZ1 KUZ Q10 Lake area in % (LA) PERC Water balance equation, lower zone: LOWER ZONE d LZ = PERC + (P – EPOT)*LA/100 - Q2 KLZ LZ Runoff, Q Q2 PARAMETERS IN THE RESPONSE FUNCTION : RUNOFF COMPONENTS : LZ : Water level, lower zone KLZ : Time constant, lower zone, 1/t Q = Q10 + Q11 + Q2 KUZ : Time constant, upper zone, 1/t Q10 = MIN (UZ, UZ1)*KUZ KUZ1 : Time constant, upper zone, 1/t Q11 = MAX (0, (UZ - UZ1)*KUZ1)) UZ : Water level, upper zone Q2 = KLZ*LZ UZ1 : Threshold for quick flow, mm PERC : Percolation to lower zone, mm/day
Model Performance Monthly NSE = 0.69 & 0.83 for NFS & HBV respectively
The GLUE Framework • GLUE: Generalized Likelihood Uncertainty Estimation • GLUE rejects the concept of a single optimal model and parameter set • Assumes all model structures and parameter sets have a likelihood of being accepted • Likelyhood depends performance as measured by a selected criteria
Conclusions • GCMs agree on Temperature rise (2-5.3 °C) leading to 3-17% increase in PET • GCMs disagree on precipitation changes (-36% to +39%) • High Sensitivity of Basin leads to extreme flow change ranges: -76% to +97% from both NFS & HBV • Ensemble mean flow is reduced by 25% & 6% for NFS & HBV respectively • Hydrological models add another uncertainty • GLUE provides a framework to propagate the uncertainty from scenarios to impacts • Probabilities are now attached to the uncertainty bounds • Small sample size lead to small difference between GLUE bounds and max/min bounds