Download
1 / 22
220 likes | 316 Vues
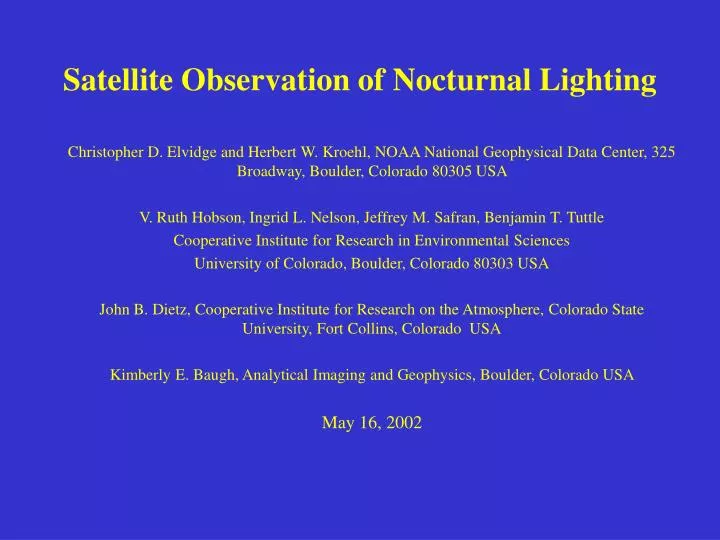
Satellite Observation of Nocturnal Lighting. Christopher D. Elvidge and Herbert W. Kroehl, NOAA National Geophysical Data Center, 325 Broadway, Boulder, Colorado 80305 USA V. Ruth Hobson, Ingrid L. Nelson, Jeffrey M. Safran, Benjamin T. Tuttle

E N D
Satellite Observation of Nocturnal Lighting Christopher D. Elvidge and Herbert W. Kroehl, NOAA National Geophysical Data Center, 325 Broadway, Boulder, Colorado 80305 USA V. Ruth Hobson, Ingrid L. Nelson, Jeffrey M. Safran, Benjamin T. Tuttle Cooperative Institute for Research in Environmental Sciences University of Colorado, Boulder, Colorado 80303 USA John B. Dietz, Cooperative Institute for Research on the Atmosphere, Colorado State University, Fort Collins, Colorado USA Kimberly E. Baugh, Analytical Imaging and Geophysics, Boulder, Colorado USA May 16, 2002
Visible (0.5 – 0.9 um) Thermal (10-12 um) DMSP-OLS The U.S. Air Force Defense Meteorological Satellite Program (DMSP) Operational Linescan System (OLS) is unique in its ability to collect global low light imagery of the earth at night. While developed to enable the detection of clouds by moonlight, the low light imaging capability has now been used to construct several global maps of human settlements. The low light imaging is accomplished using a photomultiplier tube.
EARLY HISTORY The ability to detect manmade lighting from space in DMSP-OLS data has been known since the early 1970's (Croft, T.A., 1973, Burning waste gas in oil fields. Nature, v. 245, p. 375-376). Use of this capability was limited due to the fact that the data were preserved on film. Early maps of nighttime lights derived from DMSP data were constructed using small numbers of visible band film strips. Sullivan, W.T. III, 1989, A 10 km resolution image of the entire night-time Earth based on cloud-free satellite photographs in the 400-1100 nm band. International Journal of Remote Sensing, v. 10, p. 1-5.
DIGITAL ARCHIVE In 1992 NOAA-NGDC established a digital archive for DMSP data under agreement with the U.S. Air Force. In 1994 NGDC began developing algorithms for mapping nighttime lights with digital DMSP data. Sunlit May 10, 2002 DMSP-OLS visible band image showing usable nighttime lights data, sunlit data, and glare introduced by scattered sunlight entering the OLS telescope. A faint diagonal line runs across Italy and to the northeast marks where gain changes occur in the transition from nighttime to daylight imaging occurs within the scanlines. Vertical lines reveal the photomultiplier tube electron beam shift points, designed to constrain the IFOV at the edge of scan. Glare
FIRST DIGITAL PRODUCT The earliest digital nighttime lights product was made using data from 29 orbits.
SECOND DIGITAL PRODUCT By the middle of 1995, NGDC had advanced their algorithms to include the detection of lights relative to the local background, the identification of clouds using the thermal band, and the compositing of hundreds of orbits to construct images tallying the total number of coverages, cloud-free coverages, and cloud-free light detections. The result was a capability to filter out noise and ephemeral events like fires and lightning to produce a "stable lights" dataset, with units reported in percent frequency of detection within the set of cloud-free observations. NGDC made a stable lights dataset of the USA using 236 orbits of nighttime DMSP data from the dark half of lunar cycles from a six month time period. Elvidge, C.D., Baugh, K.E., Kihn, E.A., Kroehl, H.W, Davis, E.R, 1997, Mapping of city lights using DMSP Operational Linescan System data. Photogrammetric Engineering and Remote Sensing, v. 63, p. 727-734.
FIRST GLOBAL PRODUCT The algorithms were then applied to ~1000 orbits from the dark half of lunar cycles between October 1, 1995 and March 31, 1995 to generate the first digitally derived global map of nighttime lights. Intermediate products include images tallying the total number of coverages, cloud-free coverages, and cloud free light detections. Coverages 95-120 80-94 70-79 40-69 10-29 0-9
FIRST GLOBAL PRODUCT Cloud-free Coverages 70-100 30-49 50-69 10-29 0-9
FIRST GLOBAL PRODUCT Cloud-free Light Detections
FIRST GLOBAL PRODUCT Four different types of lights were distinguished based on the location, detection frequency, and appearance: 1) human settlements (white), 2) gas flares (green), 3) fires (red), and 4) heavily lit fishing boats (blue). The initial product was completed in 1997. The data were reprocessed in 1999 with an improved light detection algorithm. Elvidge, C.D., Imhoff, M.L., Baugh, K.E., Hobson, V.R., Nelson, I., Safran,J., Dietz, J.B., Tuttle, B.T., 2001, Nighttime Lights of the World: 1994-95. ISPRS Journal of Photogrammetry and Remote Sensing, 56, pp. 81-99.
RADIANCE CALIBRATION Under normal operating conditions OLS visible band data of urban centers are saturated. In response to requests from the scientific community for radiance calibrated nighttime lights data in 1995 NGDC researched the calibration of the OLS low light imaging data. In 1996, NGDC conducted experiments with the gain settings on the OLS. It was discovered that multiple overlapping gain settings would be required to cover the full range of light levels observable from human settlements. Sample OLS data collected during gain control experiment conducted on March 16, 1996.
RADIANCE CALIBRATED NIGHTTIME LIGHTS OF THE WORLD Using 28 nights of OLS data from 1996-97 NGDC constructed the first radiance calibrated global map of nighttime lights. Istanbul Ankara Elvidge, C.D., Baugh, K.E., Dietz, J.B., Bland, T., Sutton, P.C., Kroehl, H.W. 1999, Radiance calibration of DMSP-OLS low-light imaging data of human settlements. Remote Sensing of Environment, v. 68, p. 77-88.
NIGHTTIME LIGHTS CHANGE DATA NGDC has developed methods to generate nighttime lights change products. The initial set of products cover the 1992-93 versus 2000 time periods for the USA, China, Mexico and India. The data are being analyzed to test the hypothesis that change in lights can be related to changes in GDP. CENTRAL ARIZONABlack = No change detected, may be saturated.Red = Lights substantially brighter in 2000.Yellow = New lights in 2000.Blue = Lights dimmer or missing in 2000.Pale Gray = Dim lighting detected in both time periods.
FIRE DETECTION NGDC has developed algorithms to detect fires using nighttime OLS data. The method is based on the removal of “stable lights”. NGDC provides near real time nighttime OLS data and has supplied its fire processing software to NESDIS-OSDPD for use in the USA, plus the governments of Brazil, Argentina, Singapore, Thailand and Japan. DMSP-OLS Fires From Indochina On April 5, 2002 Elvidge, C.D., Nelson, I., Hobson, V.R., Safran, J., Baugh, K.E., 2001, Detection of fires at night using DMSP-OLS data. Global and Regional Vegetation Fire Monitoring from Space: Planning a Coordinated International Effort. Edited by Ahern, F.J., Goldammer, J.G., Justice, C.O. SPB Academic Publishing bv, The Hague, The Netherlands, p. 125-144.
Applications DMSP nighttime lights were a key variable in the development of recent global population density map from the U.S. Department of Energy. Dobson, J.E., Bright, E.A., Coleman, P.R., Durfee, R.C., Worley, B.A., 2000. A Global Population Database for Estimating Population at Risk. Photogrammetric Engineering and Remote Sensing, 66(7), pp. 849-857.
Applications DMSP nighttime lights provide global observation of heavily lit fishing boats (primarily for squid). The data were used by NMFS to identify squid fishing grounds in California. It was discovered that the majority of squid fishing activity in So. California occurs in NOS-NMS waters. Frequency of offshore OLS light detection in Southern California from 1992 to 2001. Waluda, C.M., Trathan, P.N., Elvidge, C.D., Hobson, V.R., Rodhouse, P.G., 2002. Throwing light on straddling stocks of Ilex argentinus: assessing fishing intensity with satellite imagery. Canadian Journal of Fisheries and Aquatic Sciences, v. 59, p. 592-596.
Applications The U.N. Food and Agriculture Organization has used DMSP nighttime lights to assess global access to electric power and infrastructure.
Applications DMSP nighttime lights are being used to map the zonation of lighting impacts on astronomical viewing conditions (http://www.lightpollution.it/dmsp/). Cinzano, P, Falchi, F., Elvidge, C.D., 2001, The first world atlas of the artificial night sky brightness. Monthly Notices of the Royal Astronomical Society, v 328 (3), pages 689-707.
Applications DMSP nighttime lights are being used to model the percent cover of constructed materials of the USA in a NASA sponsored study on the impacts of development on terrestrial carbon dynamics. 1% Percent Cover Constructed >50%
Applications DMSP nighttime lights are being used to analyze the impacts of beach front lighting on sea turtle nesting density in Florida. Salmon, M., Witherington, B.E. and Elvidge C.D., 2000. Artificial Lighting and the Recovery of Sea Turtles. Sea Turtles of the Indo-Pacific: Research Management and Conservation. Edited by Pilcher, N. and Ismail, G. ASEAN Academic Press, London, pp. 25-34.
Other Applications Loss of agricultural land to development: Imhoff, M.L., Lawrence, W.T., Elvidge, C., Paul, T., Levine, E., Prevalsky, M., Brown, V., 1997b. Using Night-time DMSP/OLS Images of City Lights to Estimate the Impact of Urban Land Use on Soil Resources in the U.S. Remote Sensing of Environment, 59(1), pp. 105-117. ************ Population studies:Sutton, P., Roberts, D., Elvidge, C., and Baugh, K., 2001, Census from heaven: an estimate of the global population using night-time satellite imagery. International Journal of Remote Sensing, v. 22(16), p. 3061-3076. ************ Greenhouse gas emission inventory: Doll, C.N.H., Muller, J-P., Elvidge, C.D., 2000. Night-time imagery as a tool for global mapping of socio-economic parameters and greenhouse gas emissions. Ambio, v. 29(3), 157-162. Saxon, E.C., Parris, T. and Elvidge, C.D., 1997, Satellite Surveillance of National CO2 Emissions From Fossil Fuels. Harvard Institute for International Development (Harvard University), Development Discussion Paper No. 608. ************ Urban heat island studies:Gallo, K.P. and Owen, T.W., 2002, A sampling strategy for satellite sensor-based assessments of the urban heat-island bias International Journal of Remote Sensing, v. 23(9), p. 1935-1939.
Future Prospects *DMSP will continue to fly OLS sensors until 2010 or longer.* NGDC is scanning significant portions of the OLS film archive (1973-1992).* The low light imaging capability of the OLS will be continued with the VIIRS sensor during the NPOESS era.