Download
1 / 15
150 likes | 236 Vues
THE DENOISING UTILITY OF WAVELET COMPRESSION ALGORITHMS IN MAGNETIC RESONANCE IMAGING. G.E. Sarty 1 and M.S. Atkins 2 1 Royal University Hospital, Saskatoon, Saskatchewan, Canada 2 School of Computing Science, Simon Fraser University, Burnaby, British Columbia, Canada. Introduction.

E N D
THE DENOISING UTILITY OF WAVELET COMPRESSION ALGORITHMS IN MAGNETIC RESONANCE IMAGING G.E. Sarty1 and M.S. Atkins2 1Royal University Hospital, Saskatoon, Saskatchewan, Canada 2School of Computing Science, Simon Fraser University, Burnaby, British Columbia, Canada
Introduction The wavelet transform has been found to be useful in these areas of image processing: • Denoising • Data Compression • Texture Analysis • Feature and Pattern Recognition In this work we investigate the relationship between the denoising and data compression applications.
Wavelet Denoising Images can be denoised through the application of the following steps: • Transform the image into a wavelet coefficient domain. The transformed coefficients will represent image information on various scales. • Apply soft or hard thresholding to the wavelet coefficients; the threshold may or may not be scale dependent. • Transform the wavelet coefficients back to the image domain. In this work, a discrete Fourier transform method of Sarty (1) is used to compute the wavelet coefficients.
Wavelet Data Compression Image data compression can be achieved through the following steps: • Transformation: Lossless (to machine precision) wavelet transformation; decorrelates image information. • Quantization: All information loss occurs here. • Compression: Efficient lossless representation of quantized data using zerotrees of wavelet coefficients to represent significance maps. For this work, Shapiro’s (2) embedded zerotrees of wavelet coefficients (EZW) compression method is used. EZW encodes the significance map in an embedded fashion so that the most significant wavelet coefficients are coded first.
Similarities • Compression, to a precise target, is achieved with EZW by simply terminating the transmitted bit stream at the appropriate point. The resulting image, when reconstructed, contains information only from wavelet coefficients above some threshold. • To denoise an image, the wavelet coefficients below a threshold are discarded (hard thresholding) or the threshold is subtracted from all the coefficients (soft thresholding). The threshold may be constant across the wavelet scales or it may vary from scale to scale. In both instances, information from the insignificant wavelet coefficients is eliminated. The appearance of wavelet compressed images and wavelet denoised images should , therefore, be similar.
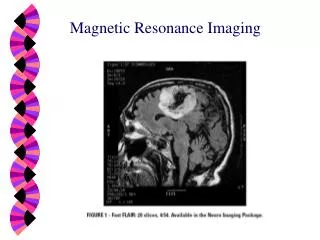
Comparison A dataset of 30 clinically acquired magnetic resonance (MR) images of ovarian masses were chosen for the purposes of comparing the wavelet denoising algorithm with the EZW compression algorithm. The database is illustrated in the next panel. Ovarian mass images were chosen because they were obtained using a body radio frequency (RF) coil which has a poor spatial filling factor relative to other, more specialized, RF coils. The poor filling factor leads to relatively noisy MR images. The efficacy of each algorithm in removing noise from the image was quantified by computing the signal-to-noise ratios (SNR) of the original and processed images. The SNR was computed by taking the signal as the average of a block of pixels entirely contained within the abdomen and taking the noise as the average of a block of pixels within the background (black) part of the image. This SNR measure is necessarily a relative one.
MR Image Dataset 1 2 3 4 5 6 7 8 9 10 11 12 13 14 15 16 17 18 19 20 21 22 23 24 25 26 27 28 29 30
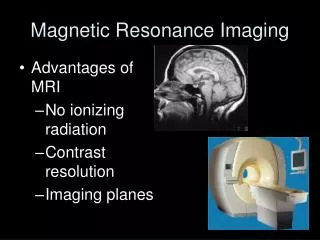
Comparison Example - Image 5 Original MR image, SNR = 32.6 Denoised Image, m = 0.5, SNR = 33.5 Compressed Image, 20:1, SNR = 29.7 • Note how each method gives a different texture to the “snowy” background noise. • In the tests, denoised images with four shrinkage thresholds, m = 0.1, 0.5, 1.0 and 2.0 were computed. EZW compression to ratios of 10:1 and 20:1 were performed.
Comparison Example - Image 19 Original MR image, SNR = 12.8 Denoised Image, m = 1.0, SNR = 14.7 Compressed Image, 20:1, SNR = 12.1 With the denoising algorithm, the SNR was improved in almost all tested cases; only one case showed a decrease in SNR. With the EZW algorithm, the SNR was improved in slightly more that half the tested cases.
Difference Images Original Image 19 Original - Denoised, m = 1.0 Original - Compressed, 20:1 Note how the differences are concentrated around the edges in the image processed with the denoising algorithm. The differences are less coherent in the EZW processed image.
Results Denoising shrinkage EZW Image# Orig. m=0.1 m=0.5 m=1.0 m=2.0 10:1 20:1 1 13.4 13.5 13.5 13.5 13.7 13.2 13.4 2 13.5 13.7 14.0 14.4 15.1 13.6 13.5 3 13.7 13.9 14.1 14.4 15.1 13.9 13.9 4 18.7 19.1 19.7 20.5 22.4 18.8 18.7 5 32.6 34.0 33.5 32.3 30.5 30.6 29.7 6 17.4 18.4 19.6 21.1 23.6 17.7 18.2 7 32.5 35.0 37.8 40.9 46.0 31.6 35.3 8 4.7 4.8 5.1 5.4 6.2 4.7 4.7 9 4.6 4.7 5.0 5.4 6.1 4.6 4.5 10 41.5 43.0 42.4 42.1 41.8 41.8 44.6 11 41.1 42.7 42.3 42.1 42.2 41.8 43.4 12 40.9 42.4 42.2 42.0 42.5 40.5 39.6 13 40.3 42.0 41.8 42.1 43.1 40.4 40.4 14 27.8 29.1 29.5 30.3 32.1 27.6 28.9 15 28.0 29.3 29.6 30.3 32.0 28.4 29.1
Results Denoising shrinkage EZW Image# Orig. m=0.1 m=0.5 m=1.0 m=2.0 10:1 20:1 16 24.8 25.9 26.3 27.0 28.8 25.2 25.6 17 22.2 23.2 23.6 24.2 25.9 22.1 22.4 18 21.9 22.9 23.2 22.9 25.2 22.0 22.3 19 12.8 13.4 13.9 14.7 16.6 12.6 12.4 20 12.3 12.8 13.3 13.9 15.4 12.3 12.1 21 8.7 8.8 8.9 9.0 9.2 8.7 8.8 22 8.9 8.9 9.0 9.1 9.3 8.9 8.8 23 9.2 9.4 9.7 10.2 11.3 9.2 9.2 24 8.3 8.4 8.8 9.2 10.3 8.3 8.3 25 19.5 20.3 21.6 23.8 27.5 19.5 19.6 26 18.7 19.5 21.5 23.8 29.2 18.8 18.8 27 8.0 8.1 8.2 8.3 8.6 8.0 8.0 28 16.7 17.4 18.0 18.7 20.3 17.0 17.2 29 12.5 13.3 13.8 14.7 17.1 12.7 11.8 30 12.5 13.3 14.2 15.4 18.5 12.6 12.7
Discussion According to Donoho, et al. (3), near minimax removal of image noise is possible by using soft thresholding on the type of wavelet coefficients used in the EZW algorithm. Except for the issue of quantization, the image delivered by EZW should be an image in which the wavelet coefficients had been subjected to hard thresholding. From the abstract work of Donoho, et al. it is not clear how one choice of wavelet over another can lead to better denoised images (i.e. to better estimates of the underlying data). Intuition, and the work of Mallat and Hwang (4), would suggest that edge-detecting wavelets, such as the Haar wavelet, would be better suited for denoising applications. The intuition being that an edge detecting wavelet would tend to gather the edge information together into the more significant wavelet coefficients, leaving the noise to the least significant wavelet coefficients. Upon thresholding, no edge information would be lost and a better reconstructed image should result. The wavelet used in EZW here was the “Coiflet” (5). Coiflets tend to produce small value wavelet coefficients in areas where the original image is smooth. Coiflets also seem to have good data compression properties, perhaps because they have a good “decorrelating” property (see earlier panel on wavelet compression). Perhaps by replacing the Coiflet with an edge-detecting wavelet, compression performance can be traded off with denoising performance.
Discussion Examination of the table of results shows that there is no optimal choice for shrinkage parameter m (which is used in conjuction with an image noise level estimate to determine the threshold used). In practice, then, the threshold must be found by a trial and error process. The use of the embedded encoding of data such as that used with the EZW wavelet transform compression algorithm could be a very useful tool for selecting the appropriate threshold. By adjusting the compression rate in real time, an operator could view a continuum of denoised images. With the threshold being so easily adjustable, an optimal denoised image could be produced in short order. The denoising numerical wavelet transform used in this work is different from the wavelet transform used for compression; it has been designed specifically for denoising (1). In addition, the denoising algorithm uses a scale-dependent threshold. It is conceivable that a compression significance map could also use a scale-dependent threshold to improve its denoising characteristics. Achieving a soft threshold within an embedded code is also conceivable; however, there is some anecdotal evidence (from some of our unpublished results) that hard thresholding leads to better images than soft thresholding.
References (1) Sarty, G.E. and Kendall, E.J., Self-Diffusion Maps from Wavelet De-Noised NMR Images, Journal of Magnetic Resonance, Series B, 111, 50-60 (1996). (2) Shapiro, J.M., Embedded Image Coding Using Zerotrees of Wavelet Coefficients, IEEE Transactions on Signal Processing, 41, 3445-3462 (1993). (3) Donoho, D.L., Johnstone, I.M., Kerkyacharian, G. and Picard, D., Wavelet Shrinkage: Asymptopia?, Journal of the Royal Statistical Society B, 57, 301-369 (1995). (4) Mallat, S. and Hwang, W.L., Singularity Detection and Processing with Wavelets, IEEE Transactions on Information Theory, 38, 617-643 (1992). (5) Daubechies, I., Ten Lectures on Wavelets, SIAM, Philadelphia, Pennsylvania (1992).