Download

1 / 13
150 likes | 283 Vues
Calculator Tutorial for Histograms TI-84. Tori Skolosh Kelsey Anderson. Data. Entering Data Into the Calculator. To enter data into your calculator, you first need to have your data to make your histogram.

E N D
Calculator Tutorial for HistogramsTI-84 Tori SkoloshKelsey Anderson
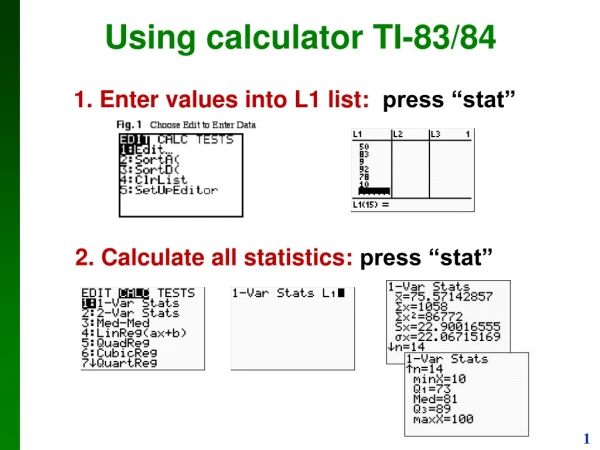
Entering Data Into the Calculator • To enter data into your calculator, you first need to have your data to make your histogram. • Go to Stat > Edit and enter your data one by one into L1 by clicking enter each time you enter a new number.
After Data Entry • After you enter your data into the calculator, follow the next slide to work on completing your histogram...
How do I find class width? • To determine your class width, take the highest number minus the lowest number, then divide by the number of classes you want, which should be over 5.
< range < number of classes ^ This is our class width. Round up to the nearest whole number. Our class width is 3. If your class width number comes out as a whole number, for example 4, then you would still round up to the nearest whole number, making your class width 5
Final Histogram • Finally, hit the Graph button to see your final histogram. It should look something like this:
Additional Tips • To tell the minimum, maximum, and number of integers in each bar of your histogram, click the Trace button and then scroll left and right to see the data for each bar.
Trace “Min” and “Max” are self-explanatory, being the minimum and maximum value of each column. The variable “n” stands for the number of data in each column.