Download
1 / 11
110 likes | 234 Vues
Calculating Variance using the TI 83+ or TI 84+. Example: computer problem, pp. 371-72. First, we will generate the tree diagram found on page 370. Next, we generate the table found on p. 372 by showing where the probabilities from the tree diagram fall into the columns of the table

E N D
Example:computer problem, pp. 371-72 • First, we will generate the tree diagram found on page 370. • Next, we generate the table found on p. 372 by showing where the probabilities from the tree diagram fall into the columns of the table • Finally, we will use the values and the probabilities in the table to enter into the TI 83+ (or TI 84+, if that’s what you have)
Where we’re going to put the data on the TI calculators List 2 List 1
Before you begin…… • Make sure you have before you the table on the previous slide (also on p.372 of the text) • You have your TI 83+ or TI 84+ turned on and ready to go • I will give you step-by-step instructions. You need not write them down, since this PowerPoint will be on the school web site. • Run through the slides again if you have problems.
Step 1:Look at the table. You’re going to place x in List1 and P(X) in List 2. • Enter STAT and choose EDIT, then press ENTER. This takes you to the Lists. Use the cursor keys to go to L1. • Enter “1,000” for L1(1); “100” for L1(2), and “0” for L1(3). Move down the list either by using the cursor keys or by hitting the ENTER key. • Move to L2 (i.e., List 2) by using the cursor keys. Go to the first entry for List 2, denominated as L2(1). Enter either the decimal equivalents listed in the table, or enter the fractional probabilities or multiplication of fractions from the tree diagram. • Be absolutely sure that you have listed the probabilities in the same order as you listed the outcomes/values. If L1(1)= 1000, you MUST have 0.057 in L2(1). FAILURE TO FOLLOW THIS WARNING WILL RESULT IN DISASTER!
Step 2: calculate! • With the 2 lists now entered, you can do the calculation. Press the STAT key. • After you press it, you will see, across the top of the screen, 3 menu items: EDIT, CALC, and TEST. Use the cursor keys to get to CALC menu, and a series of new items will appear. • Choose 1-VARar Stats (the “1:” will be highlighted) and press the ENTER key.
What your calculator should look like now: • Your calculator display should now look like this: 1-Var Stats followed by a flashing rectangular cursor. • Move on to the next slide to follow the instructions for step 3
Step 3: Linking 1-Var Stats to the lists Here, you will be typing in L1, L2. • First, depress the yellow “2nd” key in the upper left of the calculator, followed by the “1” key on the keypad. If you have correctly pushed those in order, “L1” will appear on the calculator after “1-Var Stats” • Press the comma (“,) key which just above the 7 key. Your display should now look like “1-Var Stats L1, “ • Press the 2nd key (see step 3(b) above), followed by the 2 key, which inserts “L2”. Your display should now look like this: “1-Var Stats L1, L2”
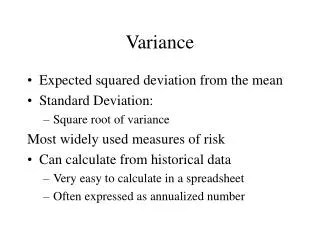
Step 4:Press ENTER key to get the following screen 1-Var Stats _ x =98.9 ∑x=98.9 ∑x2=61190 Sx= σx=226.7350657 n=1 (except that there’s a little downward arrow in front of the “n”) This is the expected value of the random variable, aka the mean (μ) This is the standard deviation the problems ask for in Chapter 16
Use this procedure to calculate standard deviations • Remember that you have to create a table of the probability model before you can • Although this procedure will calculate the expected value (aka the mean [μ]), the AP exam may well ask you to show the calculations. • Good luck! </end of slide show>