Download
1 / 23
230 likes | 361 Vues
Development and use of MonALISA high level monitoring services for Meta-Schedulers. CHEP’04 27 th September – 1 st October, 2004 Interlaken, Switzerland. Stratos Efstathiadis a , Levente Hajdu a , Jerome Lauret a , Iosif Legrand b

E N D
Development and use of MonALISA high level monitoring services for Meta-Schedulers CHEP’0427th September – 1st October, 2004Interlaken, Switzerland Stratos Efstathiadisa, Levente Hajdua, Jerome Laureta, Iosif Legrandb a Brookhaven National Laboratory, b California Institute of Technology
OUTLINE • Queue Monitoring. • b. Description of the mechanism providing monitoring data to SUMS using the MonALISA monitoring Framework. • First tests using queue monitoring in queue selection mechanisms. • Conclusions & Plans
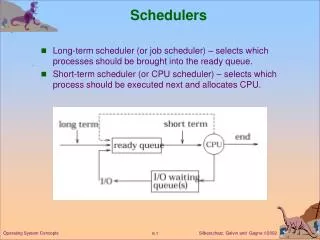
Motivations Possible phases in Grid Scheduling: • Resource DiscoveryInformation Service, JINI, … • Status of Available Resources Schedulers look into improving application turnaround time by using: • Current and past Resource status (Load, Memory, Space, Number of running/pending jobs, bandwidth etc...) • Predictions of the status of the Resources over a specific time interval or point in the future [NWS …] • Job Execution Queue Monitoring, in particular, is part of the second phase
Queue Monitoring Queue Monitoring provides aggregate status of a queuing system. It is not job monitoring. It does not provide status of individual jobs but rather the overall status of the queuing system. Why is Queue Monitoring important ? Resource Brokers need info about the state of Local Resource Management Systems (LRMS) in order to make decisions. Resource Brokers do not have control over LRMS (they cannot decide on job priorities, on which particular host a job will run … ), they cannot change local decision making mechanisms or local Usage Policies (UP) which are controlled by the resource owners. Global policies may need to adjust depending on local ones.
As a starting point, we reused work done by the GGF/GLUE Schema. The Computing Element (CE) represents the entry point into a Queuing System. One CE per Queue. Attributes in the CE State Object (per queue): RunningJobs: Number of currently running jobs. TotalJobs: Number of jobs in the CE (RunningJobs+WaitingJobs) Status: States a queue can be in (Queuing, Production, Closed, etc) WaitingJobs: Number of jobs that are in a state different than running. WorstResponseTime: Worst time between job submission till when job starts its execution in sec EstimatedResponseTime: Estimated time between job submission till when job starts its execution in sec FreeCPUs: Number of free CPUs available to a scheduler.
The MonALISA Service System Queue Monitoring Module
One monitoring module collects information for all queues/pools. Clients requesting data specify parameters as Farm/Cluster/Node/ParameterName
Initial Implementation Queue Monitoring using the MonALISA framework: • We are developing a ML Monitoring Module that provides the values of the Attributes of the CE Status Objects to be installed at each site of the group. The ML Monitoring Module will provide values for the same attributes for the most popular LRMS. • Monitoring data from each site are available as a Web Service. • Integrated Web Service Client into SUMS. Solution is not scalable, time consuming and bypasses many of the ML framework features.
The MonALISA Web Repository More details in Iosif’s presentation.
The same WS methods can retrieve monitoring data from either a monitoring site or a Web Repository.
The Web Repository Solution • Scalable solution: ML services are automatically discovered (LUSs) • The ML Web Repository provides aggregate monitoring data (real time and historical values) for several sites in a group. • The web service client in SUMS did not need to change. Issues Retrieving monitoring data from web Service: • Averaged (mediated) data • Slightly delayed data. • Single point of failure (Web Repository may become unavailable)
Local Pseudo-Client Solution The pseudo-client was provided by the ML developers. Modified to spawn another thread for each connection. • Provides latest, un-averaged data • Fast monitoring data retrieval • Easy deployment. • Several local Pseudo-client deployments are possible. • The Web Repository solution is still available as a fail-over when pseudo-clients are unavailable. No local DataBase available, so no historical data available The ML developers have provided additional WS methods to access real-time, unmediated values: getLastValues() and getFilteredLastValues(Farm,Cluster,Node,Parameter)
First tests using the queue monitoring information for queue selection in SUMS Two policies are implemented in the STAR Unified Meta-Scheduler: • one is based on submitting jobs to alternating queues (Passive Policy) • the other based on selecting queues using monitoring data: the queue monitoring attributes (Monitoring Policy). • For the testing we used local resources (LSF Queues). • For each jobs we recorded submitTime, startTime, endTime, queue, etc to calculate the actual job Pending, Running times.
The Monitoring Policy in SUMS The Monitoring Policy uses the Response Time (RT) of each queue to decide where jobs will be submitted. This is calculated for every job that is Pending or Running or finished within the last hour. EstimatedResponseTime = S (startTimei – submitTimei)/NJobs
Monitoring Policy Passive Policy
Typical case of clear choice between queues based on Response Time, but …. jobs submitted to the selected queue ended up pending longer than jobs submitted to the queue with worse Response Time.
The number of running jobs for the “chosen” queue is small, but still the submitted jobs remained pending for a longer than expected period.
Both clusters are saturated. One of the two, though, with production jobs we do not have any information about. These “external” jobs changed the profile drastically. The Response Time, being an average over time, did not “react” quickly.
First testing results • In a balanced cluster, our tests were successful, an indication that queue information could provide a good selection mechanism. • In saturated cases, our approach did not lead to satisfactory results. • The turnaround rate of Pending to Running jobs over a time interval could provide a better (next) approach. • Using the MonALISA monitoring framework we were able to establish a reliable mechanism that provided monitoring data to the STAR Unified Meta-Scheduler.
Plans: Continue studying and testing of monitoring policy. Grid testing How to handle special situations (when monitoring data are unavailable, network problems …) Can we provide information per user (fairshare policy…) ? http://www.star.bnl.gov/STAR/comp/Grid/Monitoring/MonaLisa/