Download
1 / 21
230 likes | 347 Vues
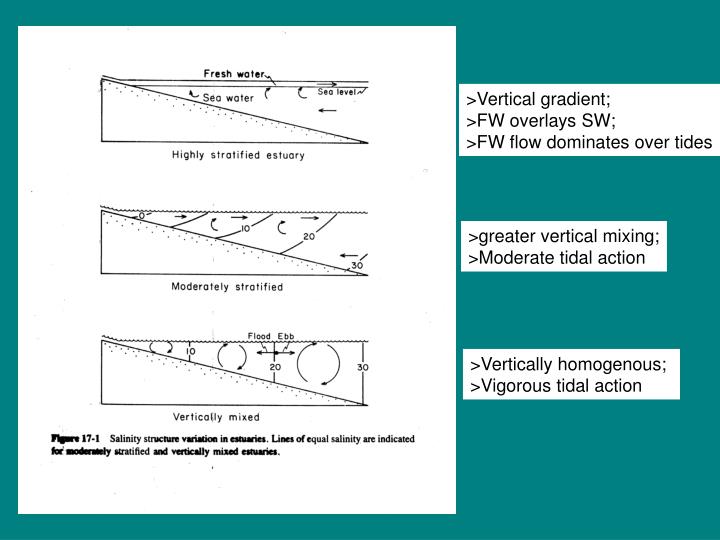
>Vertical gradient; >FW overlays SW; >FW flow dominates over tides. >greater vertical mixing; >Moderate tidal action. >Vertically homogenous; >Vigorous tidal action. Turner et al. 2006 – Hurricane sediments. Turner et al. 2006 – Hurricane sediments.

E N D
>Vertical gradient; >FW overlays SW; >FW flow dominates over tides >greater vertical mixing; >Moderate tidal action >Vertically homogenous; >Vigorous tidal action
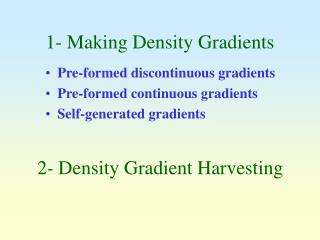
- Pulsed Flood Events – natural disturbances drive high productivity & diversity in river, floodplain and estuary
Relationship between FW species percentage and tidal influence
Abiotic gradients along a salinity gradient Coupled response between Chlorophyll, DOC and DO along the salinity gradient
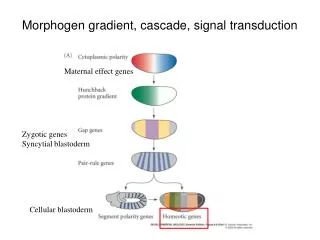
Odum’s 1984 Dual Gradient Concept Stream orders = marsh dendritic pattern River ≠ Estuary ≠ Marsh
Dual Gradient Concept: salinity & marsh stream order gradients DOC input to estuary POC input to estuary DOC gradient along marsh stream orders
Dual Gradient Concept: salinity & marsh stream order gradients POC gradient along marsh stream orders Main sources of organic carbon along marsh stream gradient
Gradients in primary production in estuaries Juvenile menhaden nursery driven by phytoplankton gradients Relationship between salinity – menhaden abundance - chlorophyll signatures (Neuse River: 2 May 1984)
Relationship between salinity – menhaden abundance - chlorophyll signatures (Neuse River: 15 May 1984) Relationship between salinity – menhaden abundance - chlorophyll signatures (Pamlico River: 16 May 1984)
Size ranges were nearly similar so fish considered same cohort
The FW/SW gradient & phytoplankton biomass max were correlated; Generally occurred within 4-6 psu in both rivers and shifted seasonally Neuse River: 4-6 psu @ 60km during early spring freshet & km 60 in summer Pamlico River: 4-6 psu @ 30km during early spring freshet & km 10 in summer
Spring – high spring flows = high primary production in lower estuary = nursery Creeks have salinity gradients with isolated chlorophyll maxima regardless of location Summer – low summer flows = high primary production in upper estuary = nursery
Harrison & Whitfield 2006 estuary typology/community structure model O = predominantly open estuary M = moderate/large (>10 ha) closed estuary S = small (< 10 ha) closed estuary Subtropical & warm-temperate: O - near top left M - near the middle S - near lower right Cold-temperate: O & M - near top left S – broad spread ANOSIM = overall difference in community structure in subtropical & warm- temperate; O most discrete. less clear in cold-temperate estuaries (no differences).
Mouth conditions & surface area = different fish communities O = species rich; allows access and recruitment form sea. L/M-C = species poor; closed w/limited access and recruitment from sea. S-C = lowest species richness; due to size and limited habitat diversity and isolation from sea. Large estuaries – increased habitat heterogeneity & increased diversity Surface area – linked to mouth width & depth, geomorphology & runoff. A = open systems B = open & L/M closed systems C = all but L/M closed mainly D = all systems but mainly in S closed systems.