Download
1 / 33
360 likes | 747 Vues
Demography. Miloslav Klugar, Ph.D., PhDr . Social Medicine and Medical Ethics Department of Social Medicine and Health Care Policy Office number: 5.087 Office hours: Friday 9:00 – 11: 00 Faculty of Medicine and Dentistry Palacky University in Olomouc. Demography.

E N D
Demography Miloslav Klugar, Ph.D., PhDr. Social Medicine and Medical Ethics Department of Social Medicine and Health Care Policy Office number: 5.087 Office hours: Friday 9:00 – 11: 00 Faculty of Medicine and Dentistry Palacky University in Olomouc
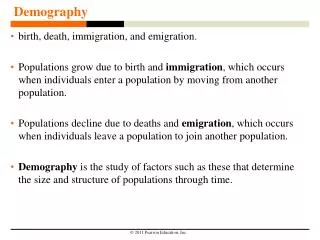
Demography • Demography – social science about population (formerly also population science) • Main subject of demographical investigation are mass biosocial phenomenon's and processes in the population • so-called population (demographical) phenomenon’s and processes • These phenomenon’s and processes related to the status and reproduction of population
Characteristics of Demography Typical border discipline Demography according to its tasks: • Description of the population > demographical statistics • Motion analysis of population dynamics > demographical dynamics • Estimates of future population development > demographical prognosis (population projections) • Aplication into the practice – a population policy and its impact on the economy, social security, health, education, industry
Demography • Goals • composition, size, migration of population • analysis of previous development • formulation of laws - how will population develop in future • Demographic data • basic data about population ( basis for studies on health status of population) • Demographic events • First -birth, death • Secondary - marriage, divorce, migration, abortion
Demographicinformationsources • Yearbooks • Demographic yearbook, UN, since 1948 (http://unstats.un.org/unsd/demographic/) • demographic info about chosen countries of the world (not detailed) • EUROSTAT (http://ec.europa.eu/eurostat) • detailed demographic info about EU countries • Czech statistical office (ČSÚ, http://www.czso.cz) • very detailed info about Czech inhabitants
As of 1 November 2010, the world population is estimated by the United States Census Bureau to be 6.879 billion.[2] According to papers published by the , the world population hit 6.5 billion (6,500,000,000) on 24 February 2006. The United Nations Population Fund designated 12 October 1999 as the approximate day on which world population reached 6 billion. This was about 12 years after world population reached 5 billion in 1987, and 6 years after world population reached 5.5 billion in 1993. However, the population of some countries, such as Nigeria and China is not even known to the nearest million,[3] so there is a considerable margin of error in such estimates.[4]
Health related data • Health service data • Sources of demographic data : • Census (population census) • Vital statistic • Migration • Population register • Specific surveys • Population estimates • Population projections • Mid year population
Sources of health data • Surveys • administrative data - rates of hospital admissions, treatment, diagnoses • registries - disease registrations for certain chronic disease (reports sent by private practitioners, clinics, pathology, departments) • reports - reports of unusual occurrences, increase in disease rates to responsibility agencies • - reportable diseases / law requires • - medical journals
Vital statistics - birth, marriage, death • In 17th Century England, John Graunt (1620 - 1674) systematized record -keeping , since than, vital statistic the most reliable and consistently recorded data source • birth certificate • death certificate - signed by licensed physician and includes cause of death, name, birth date, sex, place of residence and death
DEMOGRAPHIC STATICSPopulation and its structure • Density 1 km2 concentration • structure of population: 1) biological - sex, age 2) social legal 3) social - economic ad1) structure in accordance with sex : • index of masculinity = number of men/per 1000 women • index of femininity = number of women /per 1000 men
ad2) structure in accordance with age : • Age (biological view) • pre-reproductive age 0 - 14 years • reproductive age 15 – 49 years • post-reproductive 50 • dependency ratio – according Biological generation
Population state indicators • Age pyramid • progressive (I. BG > III. BG) • stationary (I. BG ~ III. BG) • regressive(I. BG < III. BG) http://www.ined.fr/en/everything_about_population/animations/age_pyramid/
Demographic indicators • Basic indicators • mortality – death ability • fertility – ability of reproduction • marriage – ability of making couples, which make possible a reproduction • divorce – ability to cancel out of made couples • migration – ability to move
Demographic indicators • Mortality • death rate exposition – estimate of average of population – mid-year state of population Mid-year state of population is estimated • arithmetical average of first and last value in the time period • size of population in the centre of the interval
II. Neoplasms IX. Diseases of the circulatory system X. Diseases of the respiratory system XI. Diseases of the digestive system XIV. Diseases of the genitourinary system XX. External causes of morbidity and mortality
Demographic indicators • Specificindicatorsof mortality (by age, by sex etc.) suckling mortality – mortality up to 1 yearofthesuckling´slife • suckling mortality quotient newborn mortality – mortality up to 28 daysafterchildbirth • newborn mortality quotient
Demographic indicators • Natality • natality rate • fertility rate • Europe is the continent with the lowest level of fertility worldwide. • Total fertility is defined as the average number of children live born to 1 woman during her reproductive period.
Demographic indicators • specific rate of fertility – includes age of the women • total fertility rate – average number of children, which are born to 1 woman, fertility is not changing, mortality up to 50 years is zero • net rate of reproduction – number of girls, which are born to 1 women, fertility is not changing a mortality up to 50 years is also not changing • crude rate of reproduction – number of girls, which are born to 1 women, fertility is not changing a mortality up to 50 years is zero
Demographic indicators • Newborn classification • sex – index of masculinity and feminity • vitality • legitimate • maturity – readiness to live in the real world • full-term baby • not full-term baby
Demographic indicators • Abortion • crude rate of abortion • specific rate of abortion – includes age of the women • total rate of abortion – average number of abortions per life of the women, fertility and abortion rate is not changing and death rate up to 50 years is zero
Demographic indicators • specific marriage rate • specific first marriage rate • first marriage average age
Demographic indicators • crude divorce rate • specific divorce rate • specific divorce rates
Demographic indicators • Migration • number of moved in (I) and moved out (E) • migration balance • total migration • immigration intensity • emigration intensity
Demographic indicators • Life expectancy • The decrease of mortality is reflected in the increasing life expectancy • i.e. the length of further life expected at reaching certain age. The average life expectancy at birth in EU countries approaches 77 years for men and 83 years for women. http://www.ined.fr/en/everything_about_population/animations/life_expectancy/
WHO INTERACTIVE CHART http://gamapserver.who.int/gho/interactive_charts/mbd/life_expectancy/atlas.html