Download
1 / 16
160 likes | 256 Vues
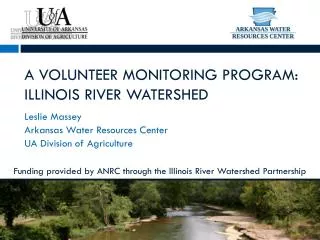
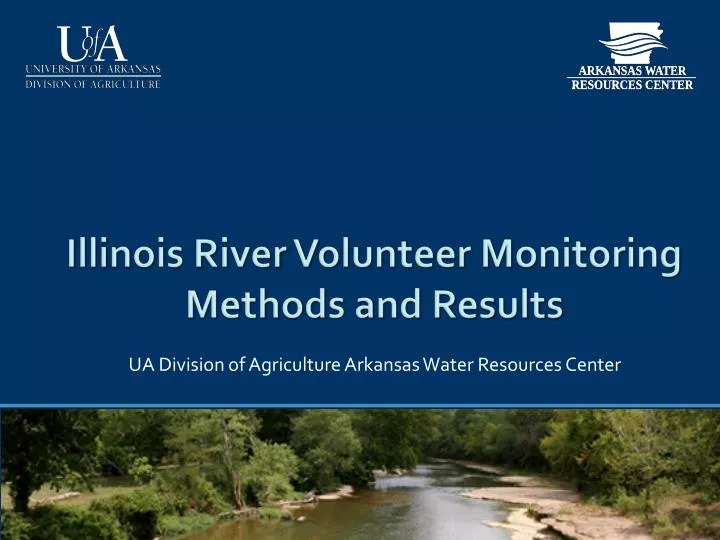
UA Division of Agriculture Arkansas Water Resources Center. Illinois River Volunteer Monitoring Methods and Results. Volunteer monitors collected water samples at 37 sites in the UIRW.

E N D
UA Division of Agriculture Arkansas Water Resources Center Illinois River Volunteer MonitoringMethods and Results
Volunteer monitors collected water samples at 37 sites in the UIRW. UA Division of Agriculture Arkansas Water Resources Center • Volunteer monitors were trained by AWRC personnel at their site(s) during September to collect and handle water samples. • Single point grab samples were collected during base flow conditions during September and December 2008 and March and May 2009. • For continuity in sampling, water samples were collected by AWRC or IRWP if volunteers were unavailable during a specific month.
Water samples were analyzed at the AWRC Water Quality Lab. • TP • TSS • Cl • F • Turbidity • Conductivity UA Division of Agriculture Arkansas Water Resources Center • Water samples were delivered to the AWRC WQL for analysis within 1 business day by trained volunteers. • Samples were analyzed for: • NO3-N • SRP • TN • We prioritized the HUC-12 based on geomean constituent concentrations for TN, TP, NO3-N and SRP • Sub-watershed sites were divided into approximately 3 equal groups of high, medium and low priority rankings (following Parker et al., 1996)
What were the methods of Parker et al. (1996)? UA Division of Agriculture Arkansas Water Resources Center Parker et al. (1996) sampled these same 37 sites from 1993-1994 during base flow conditions and storm events. They determined discharge at each site, combined it with concentration data and calculated unit area loads for each site. Parker et al. (1996) prioritized sub-watershed sites based on the calculated unit area loads. For comparison, we could only use the base flow concentrations measured by Parker et al. (1996). We re-prioritized the historical sites based on base flow concentrations only following the same method (i.e., 3 ~ equal groups of high, medium and low priority rankings).
Phosphorus in the UIRW during base flow then and now… • TP ranged from 0.02-0.14 mg L-1 • >50% as SRP • Highest concentrations downstream of WWTPs • Greatest changes between studies at sites downstream of WWTPs UA Division of Agriculture Arkansas Water Resources Center
Nitrogen in the UIRW during base flow then and now… • TN ranged from 0.39-4.49 mg L-1 • ~80% as NO3-N • TN decreased at 5 sites and only increased at 1 site • NO3-N increased at 14% of sites UA Division of Agriculture Arkansas Water Resources Center
Following the method of Parker et al. (1996) for TP: 11 High Priority Sites 10 Medium Priority Sites 16 Low Priority Sites UA Division of Agriculture Arkansas Water Resources Center
For TP, 46% of sites changed priority rankings between the historical study and the current study. Which sites shifted to a High Priority? Site 3: Goose Creek Site 19: Muddy Fork Site 21: Lower Moores Site 32: Cincinnati Site 2: Ruby Site 23: Kinion Site 8: Robinson UA Division of Agriculture Arkansas Water Resources Center UA Division of Agriculture Arkansas Water Resources Center
For TP, 46% of sites changed priority rankings between the historical study and the current study. Which sites shifted from a High to a Low Priority? Site 13: Galey Site 10: Brush Site 9: Wildcat Site 15: Little Osage Site 18: Puppy UA Division of Agriculture Arkansas Water Resources Center UA Division of Agriculture Arkansas Water Resources Center UA Division of Agriculture Arkansas Water Resources Center
For TP, 46% of sites changed priority rankings between the historical study and the current study. Following the method of Parker et al. (1996) for TN: 10 High Priority Sites 19 Medium Priority Sites 8 Low Priority Sites UA Division of Agriculture Arkansas Water Resources Center UA Division of Agriculture Arkansas Water Resources Center
For TN, 46% of sites also changed priority rankings between the historical study and the current study. Which sites shifted to a High Priority? Site 3: Goose Creek Site 33: Wedington But, no sites shifted from a high to a low priority. UA Division of Agriculture Arkansas Water Resources Center UA Division of Agriculture Arkansas Water Resources Center UA Division of Agriculture Arkansas Water Resources Center
Looking at these data, we wondered if arbitrary breakpoints were best? • Use the same breakpoints defined by Parker et al. (1996)? • Increase the number of highs and lows • Consider whether concentrations significantly increased or decreased? • 1:1 graphs • What about considering the gradient between nutrients and catchment land use? UA Division of Agriculture Arkansas Water Resources Center
In the UIWR, nutrients are positively correlated to pasture and urban land use in the catchment (based on VMP data). R2= 0.11 P=0.045 R2= 0.38 P< 0.0001 UA Division of Agriculture Arkansas Water Resources Center
The regression line represents the average conditions for the respective catchment land use. Data points over here are higher than average. Data points down here are lower than average. UA Division of Agriculture Arkansas Water Resources Center
Conclusions We successfully used trained volunteers to collect water samples at 37 sites in the UIRW to establish current water quality conditions. Between the studies, base flow constituent concentrations were significantly different at some sites. The priority rankings were updated based on the current water quality conditions following the method of Parker et al. (1996). A different prioritization method may be more beneficial to effectively target priority sub-watersheds in the UIRW. UA Division of Agriculture Arkansas Water Resources Center
The collected data is valuable for the UIRW. The data collected during this study is valuable, because data is not widely available in the smaller sub-watersheds across the UIRW. This data was used to assist in the prioritization of the HUC 12s across the larger watershed during WMP development. UA Division of Agriculture Arkansas Water Resources Center