Download
1 / 32
320 likes | 463 Vues
SOCI5013 Advanced Social Research Probability Sampling. Song Yang Spring 2007. The Theory and Logic of Probability Sampling. Nonprobability sampling cannot guarantee a representative sample of the entire population, thus all large-scale surveys use probability sampling methods.

E N D
SOCI5013 Advanced Social ResearchProbability Sampling Song Yang Spring 2007
The Theory and Logic of Probability Sampling • Nonprobability sampling cannot guarantee a representative sample of the entire population, thus all large-scale surveys use probability sampling methods. • If all members of a population were identical in all respects, studying a single case suffices as a sample to study the whole population. It never happens because human being varies in a great amount of characteristics.
Probability Sampling • Sampling bias means those selected are not typical or representative of the larger population they have been chosen from. Researchers may unconsciously induce sampling bias by choosing respondents most closest to them.
Techniques to Avoid Bias • A sample is representative of the population from which it is selected if the aggregate characteristics of the sample closely match those same aggregate characteristics in the population. • A basic principle of probability sampling is that a sample will be representative of the population from which it is selected if all members of the population have an equal chance of being selected in the sample, which is commonly called EPSEM (Equal Probability of Selection Method)
Advantages of Probability Samples • 1) probability sample, although never perfectly representative, are more representative than other types of samples such as nonprobability samples because bias is avoided. • 2) probability theory permits an estimate of the representativeness of the sample. In other words, the probability sampler can provide an accurate estimate of success or failure in its representativeness.
Elements and Population • Elements are units about which information is collected and that provides the basis of analysis. Most likely the elements in social studies are individuals. Some times, it can be families, social clubs, corporations, and nations. • Population is the theoretically specified aggregation of the elements in a study. It can be current U.S. citizen, college students, etc. • A study population is that aggregation of elements from which the sample is selected. For practical purpose, a polling firm may exclude Alaska and Hawaii from an national sampling.
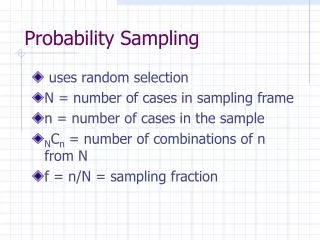
Random Selection • The purpose of sampling: to select a set of elements from a population in such a way that descriptions of those elements accurately describe the total population from which the elements are selected. • Random selection, in which each element has an equal chance of being selected, independent of any other event in the selection process, is the key to accomplishing the purpose/goal of sampling.
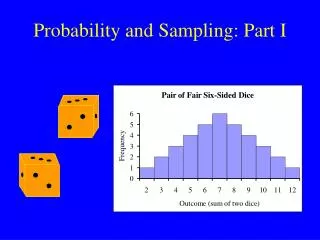
Flipping Coins • A classical illustration of random sampling is flipping coins. Each time the chance of getting a head or the tail is 50%, irrespective of all previous results. • Sampling distribution of ten cases • The conclusion: every increase in sample size improves the distribution of estimates of the mean.
Sampling Error • Sampling error: the degree of error to be expected for a given sample design. S: standard error (standard deviation for sampling distribution) P: percentage of cases equals 1 in a binary variable Q: percentage of cases equals 0 in a binary variable (Q = 100 –P) N: number of cases in each sample
Populations and Sampling Frame • A sampling frame is the list or quasi list of elements from which a probability sample is selected. Examples: • A random sample of parents of children in the third grade in public schools in Yakima county, Washington. • A sample of 160 individuals was drawn randomly from the telephone directory of Fayetteville Arkansas
A Problem • Properly drawn samples provide information appropriate for describing the population of elements that compose the sampling frame • Very often researchers select samples from a given sampling frame and make assertions about a population that is similar but not identical to the population defined by the sampling frame.
The Sequence • The sampling frame is a list of the elements composing the the study population. • Existing frame always define the study population, rather than other way around. • Have a population in minds • Search for available sampling frame • Redefine your population to accommodate your sampling frame
Elements • You can make use of list of registered voters, automobile owners, taxpayers, and telephone directories • Telephone directories have many defects in representing the entire population in a region. First is its social class bias, poor people have no phone line, rich people have many phone lines. Second, many people choose not to put their names on the list.
Principles • Findings based on a sample can be taken as representing only the aggregation of elements that compose the sampling frame • Omission is inevitable. You need to correctly assess the empirical result and not to over-generalize your findings. • Each element in a sample appears only once.
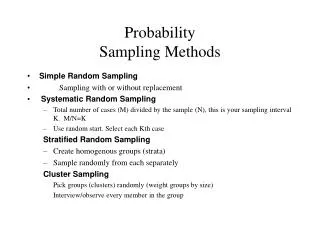
Types of Sampling Design • Simple random sampling: once you have a sampling frame, assign a unique number to each elements in the frame, and use random number generator to select cases • public class random • public static void main (String args[]) • for (int i=0; i<10; i++) • System.out.println(Math.random()*10);
Types of Sampling Design • Systematic sampling: Every Kth element in the entire list goes into the sample. Sampling interval = population size / sample size; sampling ratio = sample size/population size • Very bad choice if the sampling interval is coincident with systematic bias in the list. For example, you sample every 10th case in army roster, but army roster is arranged according to ranks and sergeants always rank the 1st, 11th and so on and so forth. You sample is either consisting of only sergeants or of absolutely no sergeants.
Stratified Sampling • Stratified samples is to first organize the population into homogeneous subsets (with heterogeneous between subsets) and to select the appropriate number of elements from each. • The goal of stratified sampling is to reduce sampling error by creating homogenous subpopulation from which the samples are selected.
Stratified Sampling • An example to produce a homogenous population in studies of college student is to create subpopulation of students based on their age cohorts. So each subpopulation consists of people with the same age. Then randomly select cases from each stratified age cohorts. • Depending on your research focus, you may stratify the population according to different variables such as sex, occupations, educations, races, social classes, incomes, etc.
Implicit Stratification • Some lists have implicit stratification. For example, a university may use students SSN to produce a roster for the entire university. So the roster is grossly stratified by geographic locations. In these cases, you need to use systematic sampling to produce homogeneous cases in terms of geography.
An example • Studying students in University of Hawaii • Sampling frame is the computerized student file containing students id, gender, name, address, SSN, major, age, and class. • Redefine the study population as day-program degree seeking, students in fall semester on the Manoa compus, including all departments, all levels, all nationalities. • Stratified the population by college class into many subpopulations.
An example • Determine the sample size to be 1,100 and ratio to be 1/14, a random number generator produces a number from 1 to 14, students of that number in every 14 students block is selected into the sample. • Due to budget cut, the sample size is down to 733. A systematic random sampling with a random start reduces the sample size to 733.
Multistage Cluster Sampling • Multistage cluster sampling first samples groups of elements, followed by the selection of elements within each of the selected clusters • Bian (1994) used multistage cluster sampling in his studies of work and inequality in urban China. He sampled 2 out of totally 6 districts in Tianjin, China, using random selection.
Bian’s Research • Within each district, there are more than 100 street blocks, which in turn have a entire list of household living in the street blocks. Bian randomly selected 10 street blocks within each district and 50 household within each street blocks. So his sample ends up having 50 * 10 * 2 = 1000 individuals because he interviewed individuals within each household. • Bian, Yanjie. 1994. Work and inequality in urban China. Albany, NY: State University of New York Press
Increasing Sampling Error • Multistage design has a defect of increasing the sampling error, which is the function of the number of stages. In previous Bian example. Researchers have a sampling error when they randomly selected district, another sampling error when they selected blocks, and one more sampling error when they select individual households. • However, for a given sample size (mostly due to budget constraint), the number of clusters trade-offs with the number of elements within each cluster.
Solutions • Solution one would be to increase the number of clusters and decrease the number of elements within each cluster for a given sample size. The reason we do this is because each cluster consists of largely homogeneous elements, which will reduce the sampling error • The second solution uses stratification for the multistage sampling. For example, using geographic location as the stratifying variable to produce stratum, within which you can randomly select churches.
Solution • U.S. census bureau has standardize this practice by asking 5 household per census block. If you need to study 2,000 household, you need to randomly select 400 blocks from the list.
Probability Proportionate to Size (PPS) Sampling • A more sophisticated sampling method called PPS ensures the same probability of being selected in multistage random cluster sampling. • We want to sample 100 blocks from a total 1,000 street blocks from a city, then within each block, sample 1 household for the study. The probability of block selection is 10%, the probability for household selection is 1/N(block household number). Thus the probability of being selected for the study is 1/(10*N) for each household. So what’s the problem?
PPS • The problem is to ensure the same probability to be selected for each household, it assumes each block has the same number of households, which is not the case for most times.
PPS • Suppose a city has ten living blocks. Block A has 100 households, whereas other blocks have 200 household/per block. • Using multistage random sampling to select 5 households, assuming a random selection of 1 block • The probability of being selected in block A is 10% * 5% = 0.5% • The probability of being selected in other blocks is 10% * 2.5% = 0.25%
Solution • PPS can solve the unequal probability of selection problem associated with multistage cluster sampling by assigning weight to change the probability of each cluster.
Solution • A city has two blocks. Block A has 100 households, block B has 10 households. We assign the probability of selecting block A 10 times of that of selecting block B. If P(B) = 1%, P(A) = 10%. Supposing we want to select 5 households each block. Households in block A has a probability of 5% of being selected, whereas household B has 50% of being selected. However overall the household in block A has 5% * 10% = 0.0005% of being selected and B has the same probability of 50% * 1% = 0.0005% chances.
Application • Suppose a city has three blocks: A (1,000 households), B(100 households), and C (10 households). • Suppose you can only sample one block and you want to study five households. • How to implement PPS to ensure EPSE (Equal Probability of Selection)?