Download
1 / 30
310 likes | 427 Vues
Bi-Op Measure 143 Water Temperature Modeling and Data Collection Plan For Lower Snake River Basin.

E N D
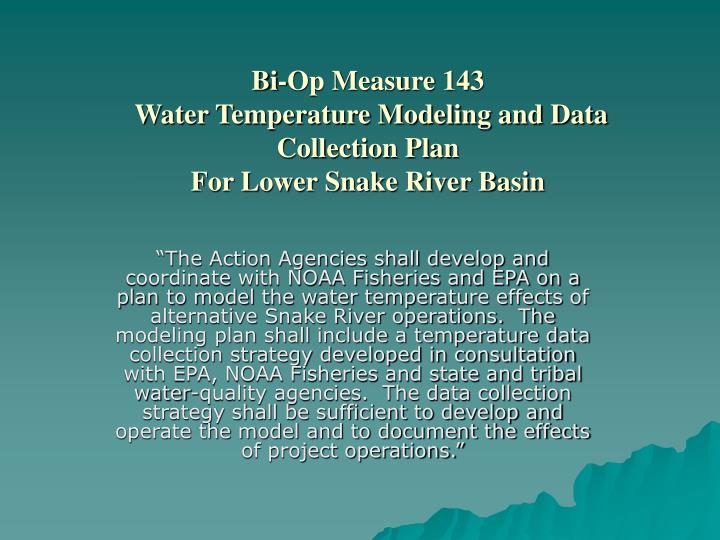
Bi-Op Measure 143 Water Temperature Modeling and Data Collection PlanFor Lower Snake River Basin “The Action Agencies shall develop and coordinate with NOAA Fisheries and EPA on a plan to model the water temperature effects of alternative Snake River operations. The modeling plan shall include a temperature data collection strategy developed in consultation with EPA, NOAA Fisheries and state and tribal water-quality agencies. The data collection strategy shall be sufficient to develop and operate the model and to document the effects of project operations.”
Water Temperature Modeling and Data Collection Plan for Lower Snake River Basin • 30 July 2003 Draft Plan/Report Complete • Reviews past and ongoing monitoring and modeling • Reviews Available Biological Information • Presents 2002 data collection and analysis • Documents model selection process • Recommends selected model • Recommends supporting data collection strategy
2002 Data Collection and Analysis • Characterized thermal patterns in the Lower Snake River System during the 2002 summer and fall period • Provided information to evaluate existing water quality monitors in representativeness for both spatial and temporal patterns in temperature and provide guidance of future sampling requirements • Provided information that helped to decide on the required model resolution and coverage. • Provided calibration and verification data for selected model
2002 Data Collection and Analysis Conclusions • Characterization of Lower Snake River Thermal Patterns • Annual vertical thermal gradient in Dworshak 12-14 °C from surface to 60 m resulting in large volumes of deeper waters at 4-6 °C • Dworshak releases of cold waters can result in rapid changes in the lower Clearwater River temperatures depending on the ratio of the warmer Clearwater River water to the North Fork • Resulting change in Lower Granite forebay water temperature is more subtle/dampened and highly dependent on the ratios of middle Snake and Clearwater River water, total discharge (travel time), and weather conditions • Annual thermal cycles are consistent for all of the study area sampling stations. Daily solar warming results in significant diel temperature cycles as well as lasting general warming on most of the riverine reaches. • Clearwater River water underflows when mixing in with the middle Snake River waters. This incomplete mixing persists throughout the length of Lower Granite pool with the colder Clearwater River water flowing underneath the warmer Snake River waters. There appears to be slight warming of the surface waters.
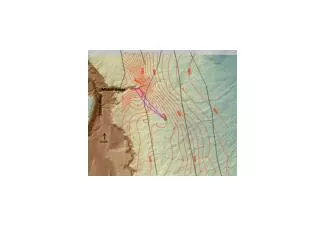
2002 Data Collection and Analysis Conclusions (Continued) • Characterization of Lower Snake River Thermal Patterns • Annual vertical thermal gradient in Lower Granite pool of 6 °C from surface to bottom exists from early July until mid September • Stations downstream of Lower Granite dam indicated much weaker vertical thermal gradients. • Longitudinal thermal gradients due to warming as the water flowed down the Lower Snake were indicated. The change was gradual with a total change of 2 °C from Lower Granite Dam down to Ice Harbor Dam during the July-August period. • A longitudinal increase of approximately 1 °C occurred in the Lower Granite pool from the head waters down to the dam. • Longitudinal changes of approximately 1 °C were indicated in the downstream reaches of the Clearwater River • Occasional warming by 0.5 °C was detected on the middle Snake River from river mile 170 down to river mile 156 during the July-August period. • Lateral thermal gradients were minimal in relation the vertical and even some of the longitudinal gradients. The average lateral differences recorded were in the order of 0.2 °C.
2002 Data Collection and Analysis Conclusions (Continued) • Evaluation/Representativeness of Fixed Water Quality Monitors • The tailwater monitor was a good measure of tailwater and average forebay water temperature even during periods of significant vertical gradients. Forebay profile column average data was found to be no different from the tailwater fixed monitor data. • The forebay monitors were generally comparable to the 5 m profile instruments as would be expected during the stratified period. • Both tailwater and forebay samples are point measures in space but the tailwater reach is generally well mixed and made up of a fairly uniform blend of the forebay water in the case of the Lower Snake projects. • The forebay instrument is positioned at one discreet depth in an area that can experience some significant vertical thermal gradients and will be a biased measure of forebay temperature.
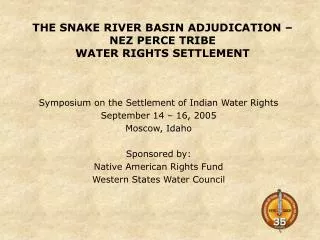
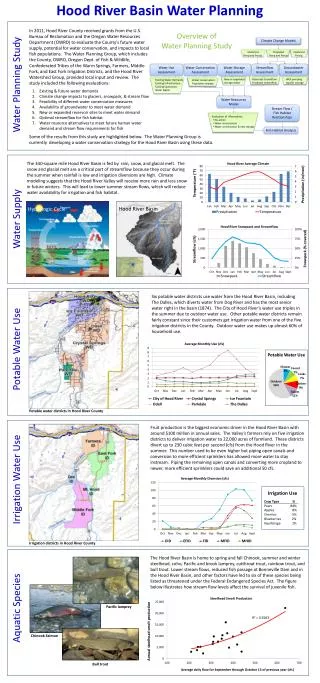
Lower Snake River Average Monthly Flow and Temperature Properties, August 1995-2003 1.2 million acre-ft storage Water Temp Dworshak Dam CWR @ DWK Temp=9.4 oC Flow = 12.4 kcfs warmer cooler CWR @ Lewiston Temp=12.7 oC Clearwater River CWR @ Orofino Temp=21.5 oC Flow = 2.3 kcfs SR @ LWG FB Temp=20.8 oC Snake River Snake River Lower Granite Dam SR @ Anatone Temp=22.1 oC Flow = 20.2 kcfs 0.427 million acre-ft storage USBR SR @ LWG TW Temp=18.8 oC Flow = 33 kcfs picasso
Daily average water temperature on the Clearwater River at Spalding, 1959-2003 Dec Nov Oct Sep Aug Jul Jun May Apr Mar Feb Jan 1990 1965 1970 1980 1985 1995 1960 1975 2000 Year
Temperature profile time histories for Lower Granite forebay, 2002
Thermal Patterns in Lower Granite Pool, June 29-August 8, 2002
Model Selection • Based on 2002 data collection/analysis and other model selection criteria, the RPA 143 technical team recommends using CEQUAL-W2 model for this modeling effort. • 2 dimensional (laterally averaged) hydrodynamic/water quality model • Model code is non-proprietary • Long history of successful applications river/reservoir systems • Supported by USACE ERDC • Handles other WQ parameters in addition to temperature. • Required computer resources are modest
Data Collection StrategyWater Temperature Routine Sampling • Continue water quality monitoring at each project tailwater and forebay (long term) with the following recommendations • Forebay monitoring stations • Relocate stations to avoid near-structure influences • Replace point monitoring approach with a vertical profiling approach • Temperature string • Real time access to data • No change in location of tailwater sampling station • Maintain year round sampling • Add stations as necessary to support management/modeling needs
Data Collection Strategy River/Tributary Monitoring • Fixed temperature logging at the following locations: • Snake mainstem at Anatone • Clearwater at Orofino, DWQI across river • Toucannon • Palouse • Grande Ronde • Salmon • Snake mainstem at Hells Canyon tailrace • Snake mainstem at head of Brownlee Reservoir • North Fork Clearwater upstream of Dwk Reservoir
Data Collection Strategy Water discharge/Project Operation • Continue close interval project operations data collection through 2003-2004 • Continue routine COE operations data collection
Data Collection StrategyMeteorological Data – High Priority • Continue current weather stations (Long-term) • Pasco, WA, airport (National Weather Service) • Lewiston, ID, (National Weather Service) • Lake Bryan-Rice Bar, WA, near little Goose Dam (Agri-Met) • Silcott Island, WA, upstream Lower Granite pool (Agri-Met) • Dworshak pool/Dent Acres, ID (Agri-Met) • Fish Hook Park, Ice Harbor Pool (PAWS) • Add a weather stations on the Snake River (Hells Canyon, Cache Bar) • Parameters • Air temperature • Dew Point temperature • Barometric pressure • Wind speed • Wind direction • Solar radiation • Precipitation • Cloud Cover
Data Collection StrategyDatabase Operation • Continue maintenance of research database • Water temperature (research and routine) • COE-WES (in river) • COE-NWW (routine water quality) • PNNL • IDEQ • Idaho Power • USGS • COE-NWW (in-project fishway thermal data) • Project operations data • Routine • Special operations close interval • Weather data • Incorporate historical data for research evaluations and trend analysis
Proposed Model Implementation • Objective • Water temperature management for habitat improvement in the Lower Snake River Basin • Approach • Development of Numerical Model and Data input • CE-QUAL-W2 • 2D Laterally Averaged Hydrodynamic-Water Quality Model • Velocity, stage, temperature • Reservoir/River Systems • Short and Long Term Forecasts - Hydrologic and Meteorologic Conditions
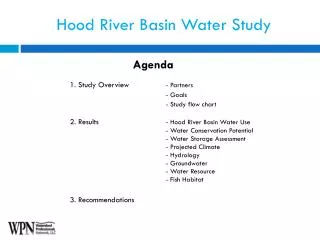
CE-Qual-W2 SimulationCold Water Discharge into Warm Water Body
Proposed Model Implementation • Goals • Operational Model by Summer of 2004 • Domain Phase I • Clearwater River @ DWK to confluence of Snake River • Snake River from Anatone (RM 167) to Lower Granite Dam • Decision support • Water control alternatives (flow augmentation) • Temperature control alternatives at Dworshak Dam • Fisheries Management (summer/fall temperature targets)
Proposed Model Implementation • Model Development Team • US Army Corps of Engineers-Leadership • Walla Walla District • ERDC • Partnership of Regulatory Agencies • EPA • State of Washington • State of Idaho • State of Oregon • BPA, BOR, IP, Tribes, NOAA, USFW
Proposed Model Implementation • Initial Tasks • Data Analyses • Flow, Stage, Velocity • Water Budget Estimates • Water Temperature • Reach Specific Heat Budget • Channel Bathymetry • Stage/Storage Relationships • Meteorology • Heat exchange processes • Biology • Timing and Abundance of Runs • Coupled interactions with flow, temperature • Hydraulic Structure • Outlet features and stratified flow
Proposed Model Implementation • Tasks • Numerical Grid Generation • Boundary Conditions • Model Calibration • Parameter determination • Model Verification • Model Application • forecasting
Decision Support - TMT • What decisions are needed to begin “Real Time” management using the temperature model? • What we can control • Dworshak release temperature • Dworshak flow • Snake flow?? • Constraints – examples • General water supply outlook • Minimum temperature in the Clearwater • Minimum flow from Dworshak during particular weeks for the purpose of simply “moving fish”
Decision Support • Pilot Water Temperature Targets • E.g., “Daily average temperature in Granite tailrace in normal snowpack year=“ • “19.0 deg C from June 1 – Sept 15” • “Draft TMDL Targets – July 7 – Sept 30” • “As cold as we can get it all summer, until 1520’” • Don’t need a model to shoot for this target
Real Time What is necessary flow from Dworshak now to meet target at Lower Granite a few days from now? • Predictive Application of the Model • Using: • Today’s measured conditions at system boundaries (flow,temp) • weather and flow forecasts for coming week • release temperature constraints • Vary the Dworshak flow until target is met • Step forward one day and do it again
Potential Benefits of Real Time Management • Conservation of DWK cold water – saving water during cool weather • Fewer, smaller temperature spikes • Clearer basis for operational changes • Less decision making burden on TMT • Over time, better understanding of what is possible