Download
1 / 1
10 likes | 122 Vues
Congresso del Dipartimento di Fisica. Highlights in Physics 2005. 11 – 14 October 2005, Dipartimento di Fisica, Universit à di Milano. Fluctuations and Pattern Formation in Fluids with Competing Interactions. A. Imperio * , A. Parola † , D. Pini ** , and L. Reatto **

E N D
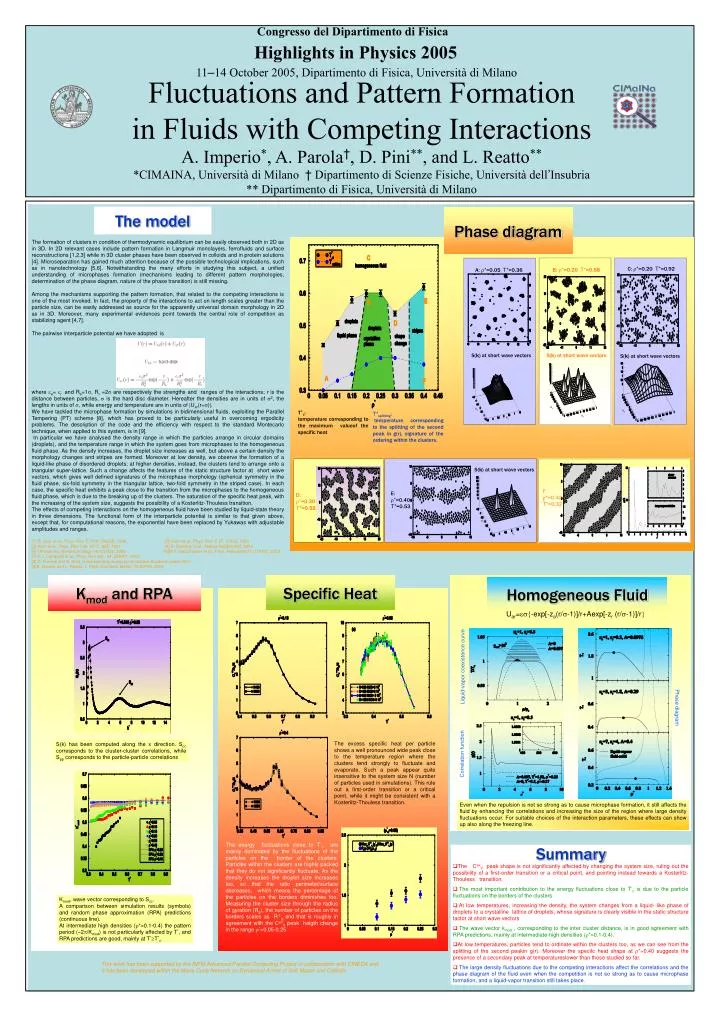
Congresso del Dipartimento di Fisica Highlights in Physics 2005 11–14 October 2005, Dipartimento di Fisica, Università di Milano Fluctuations and Pattern Formation in Fluids with Competing Interactions A. Imperio*, A. Parola†, D. Pini**, and L. Reatto** *CIMAINA, Università di Milano † Dipartimento di Scienze Fisiche, Università dell’Insubria ** Dipartimento di Fisica, Università di Milano The model Phase diagram The formation of clusters in condition of thermodynamic equilibrium can be easily observed both in 2D as in 3D. In 2D relevant cases include pattern formation in Langmuir monolayers, ferrofluids and surface reconstructions [1,2,3] while in 3D cluster phases have been observed in colloids and in protein solutions [4]. Microseparation has gained much attention because of the possible technological implications, such as in nanotechnology [5,6]. Notwithstanding the many efforts in studying this subject, a unified understanding of microphases formation (mechanisms leading to different pattern morphologies, determination of the phase diagram, nature of the phase transition) is still missing. Among the mechanisms supporting the pattern formation, that related to the competing interactions is one of the most invoked. In fact, the property of the interactions to act on length scales greater than the particle size, can be easily addressed as source for the apparently universal domain morphology in 2D as in 3D. Moreover, many experimental evidences point towards the central role of competition as stabilizing agent [4,7]. The pairwise interparticle potential we have adopted is where a= r and Ra=1, Rr =2 are respectively the strengths and ranges of the interactions; r is the distance between particles, is the hard disc diameter. Hereafter the densities are in units of 2, the lengths in units of , while energy and temperature are in units of |Uar(r=)|. We have tackled the microphase formation by simulations in bidimensional fluids, exploiting the Parallel Tempering (PT) scheme [8], which has proved to be particularly useful in overcoming ergodicity problems. The description of the code and the efficiency with respect to the standard Montecarlo technique, when applied to this system, is in [9]. In particular we have analysed the density range in which the particles arrange in circular domains (droplets), and the temperature range in which the system goes from microphases to the homogeneous fluid phase. As the density increases, the droplet size increases as well, but above a certain density the morphology changes and stripes are formed. Moreover at low density, we observe the formation of a liquid-like phase of disordered droplets; at higher densities, instead, the clusters tend to arrange onto a triangular super-lattice. Such a change affects the features of the static structure factor at short wave vectors, which gives well defined signatures of the microphase morphology (spherical symmetry in the fluid phase, six-fold symmetry in the triangular lattice, two-fold symmetry in the striped case). In each case, the specific heat exhibits a peak close to the transition from the microphases to the homogeneous fluid phase, which is due to the breaking up of the clusters. The saturation of the specific heat peak, with the increasing of the system size, suggests the possibility of a Kosterlitz-Thouless transition. The effects of competing interactions on the homogeneous fluid have been studied by liquid-state theory in three dimensions. The functional form of the interparticle potential is similar to that given above, except that, for computational reasons, the exponential have been replaced by Yukawas with adjustable amplitudes and ranges. [1] R. Sear et al., Phys. Rev. E 59(6): R6255, 1996 [2] Islam et al., Phys. Rev. E 67: 21402, 1996 [3] Kern et al., Phys. Rev. Lett. 67(7): 855, 1991 [4] A. Stradner et al., Nature 432(25):492, 2004 [5] I.W.Hamley, Nanotechnology 14(10):R39, 2003 [6]M.V. Sapozhnikov et al., Phys. RevLett90(11):114301, 2003 [7] A. I. Campbell et al., Phys. Rev. lett:. 94: 208301, 2005 [8] D. Frenkel and B. Smit, Understanding molecular simulation,Academic press 2001 [9]A. Imperio and L. Reatto, J. Phys.:Condens. Matter, 16:S3769, 2004 C: *=0.20 T*=0.92 B: *=0.20 T*=0.58 A: *=0.05 T*=0.36 S(k) at short wave vectors S(k) at short wave vectors S(k) at short wave vectors T*c: temperature corresponding to the maximum valueof the specific heat Ky Ky Ky T*splitting: temperature corresponding to the splitting of the second peak in g(r), signature of the ordering within the clusters. Kx Kx Kx S(k) at short wave vectors F: *=0.40 T*=0.32 E: *=0.40 T*=0.53 D: *=0.30 T*=0.52 Kx Kx Ky Kmod and RPA Specific Heat Homogeneous Fluid Uar=-exp[-za(r/-1)]/r+Aexp[-zr (r/-1)]/r Liquid-vapor coexistence curve Phase diagram The excess specific heat per particle shows a well pronounced wide peak close to the temperature region where the clusters tend strongly to fluctuate and evaporate. Such a peak appear quite insensitive to the system size N (number of particles used in simulations). This rule out a first-order transition or a critical point, while it might be consistent with a Kosterlitz-Thouless transition. S(k) has been computed along the x direction. Scc corresponds to the cluster-cluster correlations, while Spp corresponds to the particle-particle correlations Correlation function Even when the repulsion is not so strong as to cause microphase formation, it still affects the fluid by enhancing the correlations and increasing the size of the region where large density fluctuations occur. For suitable choices of the interaction parameters, these effects can show up also along the freezing line. The energy fluctuations close to T*c are mainly dominated by the fluctuations of the particles on the border of the clusters. Particles within the clusters are highly packed that they do not significantly fluctuate. As the density increases the droplet size increases too, so that the ratio perimeter/surface decreases, which means the percentage of the particles on the borders diminishes too. Measuring the cluster size through the radius of gyration (Rg), the number of particles on the borders scales as R-1g, and that is roughly in agreement with the CexV peak heigth change in the range *=0.05-0.25 Summary • The CexV peak shape is not significantly affected by changing the system size, ruling out the possibility of a first-order transition or a critical point, and pointing instead towards a Kosterlitz-Thouless transition. • The most important contribution to the energy fluctuations close to T*c is due to the particle fluctuations on the borders of the clusters • At low temperatures, increasing the density, the system changes from a liquid- like phase of droplets to a crystalline lattice of droplets, whose signature is clearly visible in the static structure factor at short wave vectors • The wave vector kmod , corresponding to the inter cluster distance, is in good agreement with RPA predictions, mainly at intermediate-high densities (*=0.1-0.4). • At low temperatures, particles tend to ordinate within the clusters too, as we can see from the splitting of the second peakin g(r). Moreover the specifc heat shape at *=0.40 suggests the presence of a secondary peak at temperatureslower than those studied so far. • The large density fluctuations due to the competing interactions affect the correlations and the phase diagram of the fluid even when the competition is not so strong as to cause microphase formation, and a liquid-vapor transition still takes place. Kmod, wave vector corresponding to Scc. A comparison between simulation results (symbols) and random phase approximation (RPA) predictions (continuous line). At intermediate high densities (*=0.1-0.4) the pattern period (2/Kmod) is not particularly affected by T*, and RPA predictions are good, mainly at T*T*c. This work has been supported by the INFM Advanced Parallel Computing Project in collaboration with CINECA and It has been developed within the Marie Curie Network on Dynamical Arrest of Soft Matter and Colloids