Download
1 / 34
450 likes | 912 Vues
Runway Capacity. Runway Capacity. Ability to accommodate Departures Arrivals Minimize delays Computational models Minimum aircraft separation FAA Handbook. Basic Concepts. Time. δ ij. A-A δ ij (mi). v i. γ. v i. δ ij. v j. v j. Entry Gate. Basic Concepts. Time. t ij. δ d.

E N D
Runway Capacity • Ability to accommodate • Departures • Arrivals • Minimize delays • Computational models • Minimum aircraft separation • FAA Handbook
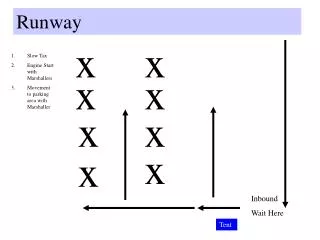
Basic Concepts Time δij A-A δij (mi) vi γ vi δij vj vj Entry Gate
Basic Concepts Time tij δd δij A-A δij (mi) vi D-D tij (sec) γ D-A δd (mi) vi δij A-D Clear runway vj vj Entry Gate
Example (1/3) Entry gate 7 miles; D-D 120 sec; D-A 2 miles; A-A: J-K 3 miles, J-J K-K 4 miles, K-J 5miles; Arrival times: J 280 sec, K 245 sec; Runway occupancy and lift off roll 40 sec Runway capacity for pattern K K J K J?
Example (2/3) K 35 sec/mi; J 40 sec/mi K-K Same speed K-J Opening J-K Closing 7 mi K-J Opening K K J K J
Example (2/3) K 35 sec/mi; J 40 sec/mi K-K Same speed 3 4 K-J Opening J-K Closing 7 mi K-J Opening 5 5 K K J K J
Example (2/3) 285 425 635 740 910 K 35 sec/mi; J 40 sec/mi 245 K-K Same speed 3 4 K-J Opening J-K Closing 7 mi K-J Opening 5 5 K K J K J
Example (3/3) 285 425 635 740 910 245 2 mi 120 7 mi K K J K J
Example (3/3) 285 425 635 740 910 245 2 mi 120 Capacities Avg time of arrivals (910-245)/4 pairs = 166.25 sec CA = 3600/166.25 = 21.7 A/hr 7 mi Three departures for four pairs (0.75) CM = (3600/166.25)(1+.75) = 37.4 Ops/hr K K J K J
Error Free Operations • Arrival & departure matrices • Same rules • Inter-arrival time • vi≤ vjTij = δij/vj • vi>vjTij = (δij/vi) +γ [(1/vj) –(1/vi)] control in airspace Tij = (δij/vj) +γ [(1/vj) –(1/vi)] control out of airspace • D-A min time δd/vj Closing case Opening case
Example (1/3) Entry gate 7 miles; D-D 120 sec; D-A 2 miles; A-A: J-K 3 miles, J-J K-K 4 miles, K-J 5miles; Arrival times: J 280 sec, K 245 sec; Runway occupancy and lift off roll 40 sec; Control in airspace. Speeds: K 103 mph; J 90 mph Runway capacity for error free operations for K 60% and J 40%?
Example (2/3) Lead Tij Speeds K 103 mph; J 90 mph Trail K-K δij/vj = (4/103) 3600 = 140 sec J-J δij/vj = (4/90) 3600 = 160 sec J-K δij/vj = (3/103) 3600 = 105 sec K-J (δij/vi) +γ [(1/vj) –(1/vi)] =(5/103 +7(1/90 -1/103))3600 = 210 sec Tij Lead Pij E(Tij) = ΣPijTij = .16(160)+.24(210)+.24(105)+.36(140) = 151.6 sec Trail CA = 3600/151.6 = 23.7 Arr/hr
Example (3/3) E(δd/vj) = 0.6 [2(3600)/103] + 0.4 [2(3600)/90] = 74 sec E(td) = 120 sec E(Ri) = 40 sec For departures between arrivals E(Tij) =E(δd/vj) +E(Ri) + (n-1) E(td) For 1 departure E(Tij) = 74 + 40 + (1-1) 120 = 114 For 2 departures E(Tij) = 74 + 40 + (2-1) 120 = 234 Lead Lead Total Pij 0.76 Trail Trail CM = (3600/151.6)(1.76) = 41.8 Ops/hr
Example (3/3) What if at least 2 departures 20% of the time? For 2 departures required E(Tij) = 74 + 40 + (2-1) 120 = 234 sec Increase some Tij to 234 sec E(Tij) = ΣPijTij = .16(160)+.24(234)+.24(105)+.36(140) = 157.4 sec Lead Lead Trail Trail CM = (3600/151.6)(1 + 1 (.16+.36) + 2 (.24)) = 45.7 Ops/hr
Position Error Operations • Aircraft can be ahead or behind schedule • Need for buffer to avoid rule violation • Aircraft position is normally distributed • Buffer (Bij) • vj> vi zσ • vj<vi zσ – δ[(1/vj)-(1/vi)] where σ standard deviation; z standard score for 1-Pv; Pv probability of violation Closing case Opening case
Aircraft Position δij δij σ P Error
Lead Example (1/2) K 103 mph; J 90 mph Trail For same operations, assume a Pv 10% and σ= 10 sec and estimate new capacity. K-K σ z = 10 (1.28) = 12.8 sec J-J σ z = 10 (1.28) = 12.8 sec J-K σ z = 10 (1.28) = 12.8 sec K-J σ z -δij [(1/vj) –(1/vi)] =(12.8 -5(3600/90 -3600/103) = -12.44 … use 0 sec Bij Lead E(Tij) = ΣPijTij = .16(172.8)+.24(210)+.24(117.8)+.36(152.8) = 161.3 sec Trail CA = 3600/161.3 = 22.3 Arr/hr
Example (2/2) E(δd/vj) = 0.6 [2(3600)/103] + 0.4 [2(3600)/90] = 74 sec E(td) = 120 sec E(Bij) = 12.8(0.76)=9.7 sec E(Ri) = 40 sec For departures between arrivals E(Tij) = E(δd/vj) +E(Ri) + (n-1) E(td) + E(Bij) For 1 departure E(Tij) = 74 + 40 + (1-1) 120 + 9.7 = 123.7 For 2 departures E(Tij) = 74 + 40 + (2-1) 120 +9.7 = 243.7 Lead Lead Total Pij 0.76 Trail Trail CM = (3600/161.3)(1.76) = 39.3 Ops/hr
Runway Configuration • Approach works for single runway • Adequate for small airports • Charts and software is used for more than one runways
Runway Configuration Selection • Annual demand • Acceptable delays • Mix Index • C+3D percentages
Example For a demand of 310,000 operations, maximum delay of 5 minutes, and MI 90 VFR, 100 IFR determine possible runway configurations Possible Options C ASV 315000 D ASV 315000 L ASV 315000 Demand/Service 310000/315000 = .98 Delays 1-3.5 min All OK
Factors for Capacity (see p. 303) • Aircraft mix • Class A (single engine, <12,500 lbs) • Class B (multi-engine, <12,500 lbs) • Class C (multi-engine, 12,500-300,000 lbs) • Class D (multi-engine, > 300,000 lbs) • Operations • Arrivals • Departures • Mixed • Weather • IFR • VFR • Runway exits
Example (1/3) Two parallel runways; Aircraft classes: A 26%; B 20%; C 50%; D 4%; Touch and go 8%; 2 exits at 4,700 ft and 6,500 ft from arrival threshold; 60% arrivals in peak hour. Capacity?
Example (2/3) C= 92* 1* 1 = 92 ops/hr
Example (3/3) C= 113* 1.04* 0.90 = 106 ops/hr
Annual Service Volume • Runway use schemes • Weighted hourly capacity (Cw) • Annual service volume • ASV = Cw D H where D daily ratio; H hourly ratio
Weighted Capacity Cw = Σ Ci Wi Pi/ Σ Wi Pi where Pi percent of time for Ci; Wi weight weights Dominant Capacity: Greatest percent time use
Example (1/3) capacity VFR IFR 70% - 110 ops 80% - 88 ops A 0% - 0 ops 20% - 88 ops B 20% - 55 ops 10% - 40 ops C VFR 85%, MI 60; IFR 15% MI 95
Example (2/3) 85% x 70% = 59.5% 88/110 Cw = ΣCi Wi Pi/ Σ Wi Pi = 770/5.70= 74.0 ops/hr
Example (3/3) Annual demand: 294,000 ops; average daily traffic 877 ops; peak hour 62, MI 90 VFR/ 100 IFR What will be the Annual Service Volume that could be accommodated for the runway system shown? ASV = Cw D H = 74 (294000/877) (877/62) = 350,900 ops/year