Download
1 / 44
450 likes | 686 Vues
INNOVATIVE PROCEDURES FOR INCREASING OF THE AIRPORT RUNWAY CAPACITY. Dr Milan Janic Senior Researcher & Research Programme Leader Delft University of Technology The Netherlands Email: janic@otb.tudelft.nl. Contents. 1 Introduction 2 The system of parallel runways

E N D
INNOVATIVE PROCEDURES FOR INCREASING OF THE AIRPORT RUNWAY CAPACITY Dr Milan JanicSenior Researcher & Research Programme Leader Delft University of TechnologyThe Netherlands Email: janic@otb.tudelft.nl
Contents 1 Introduction 2 The system of parallel runways 3 Procedures to approaching dependent parallel runways 4 Modelling the capacity of dependent parallel runways 5 Application of the model 6 Qualitative evaluation 7 Conclusions 8 The lessons learnt
1 Introduction(1) Factors influencing the airport capacity: • The number and configuration of runways • The ATC separation rules; • Technologies for navigation, surveillance,trafficmanagement, communications, andinformation; • Mix of the aircraft wake-vortex categories & arrival/departure speeds; • Proportions of the arrival/departure demand; • The ATC tactics of sequencing particular aircraft categories (FCFS, priorities); • Other economic and environmental/social constraints.
1 Introduction(2) • The number of runways depends on the airport size; i.e. the volume of traffic and the available land, and vice versa; • Configuration of runways depends on the metrological conditions (wind, visibility) given the airport annual utilisation rate of nearly 100%; • The runway system can consist of a single, two or more parallel, intersecting, and converging/diverging runways, and their combinations.
1 Introduction(3) Technologies to increase the runway capacity: • Air traffic flow management tools (CTAS, Integrated Arrival and Departure Manager); • Air Traffic surveillance equipment (RADAR, PRM – Precision Runway Monitor); • Improved and innovative avionics (FMS 4D RNAV, WAAS, AILS, TCAS, LVLASO, GPS. ADS-B, CDTI); • Distributed air/ground solutions (Combinations of ADS-B, TCAS, Free Flight devices)
2The system of parallel runways(1)Diversity Configuration of parallel runways: • Closely spaced (700 – 2499 ft); • Intermediate spaced (2500 – 4299 ft); • Far spaced(≥ 4300 ft); Statistics: U.S. busiest airports: • 28 pairs of closely spaced parallel runways • 10 pairs of intermediate spaced parallel runways • 28 pairs of far spaced parallel runways Statistics: European busiest airports: • Frankfurt– 1 pair of closely spaced (parallel) runways; • London Heathrow– 1 pair of far spaced parallel runways; • Paris Charles de Gaulle– 2 pairs of far spaced parallel runways; • Amsterdam Schiphol– 3 pairs of far spaced parallel runways.
2The system of parallel runways (2)Degree of dependency U.S. IFR/IMC Independent –with PRM
1000ftt 1000ft 1200ft ATL – Atlanta Hartsfield International BOS – Boston Logan International 2The system of parallel runways(3)Cases in the U.S.
700ft 1200ft 1200ft 700ft DFW – Dallas-Fort Worth International LAX – Los Angeles International 2The system of parallel runways (4)Cases in the U.S.
750ft 750ft SFO – San Francisco International 2The system of parallel runways (5)Cases in the U.S.
3Approach procedures to dependent parallel runways (1)The problem • The traffic dependency on the runways is caused by the in-trail wake-vortex generated and moving behind the aircraft and between the final approach paths of both runways by crosswind; • Mitigating impactsof the wake-vortex implies reducing of the current ATC IFR separation rules between aircraft, thus the degree of the runway and traffic dependency, and consequently increasing of the system capacity.
3Approach procedures todependent parallel runways (2) Current procedures:Weather minima: • VFR (Paired) ApproachC - 3500 ft; V - 6 nm • The Simultaneous Offset IndependentApproach (SOIA/PRM)C - 1600 ft; V - 4 nm • The baseline IFR ApproachC -0 ft; V - 0.1nm Innovative procedures: • The FAA/NASA TACEC (2020) C: 0 ft ; V - 0.1 nm • High Approach Landing System/Dual Landing Threshold (HALS/DLT) or Staggered Approach C: 0 ft ; V - 0.1 nm • Steeper Approach (SAP)C: 0 ft ; V - 0.1 nm
3Approach procedures todependent parallel runways (3a)Current procedures • VFR (paired) approach
W Maximum crosswind 27R i j D 27L k Blunder zone ik SZik = (d/W)vk l Safe Zone SZik 3Approach procedures to dependent parallel runways (3b)Current procedures • The Simultaneous Offset (SOIA/PRM)Independent Approach (and partially TACEC)
k i Sik0 Maximum crosswind 27R j i 27L Blunder zone k Minimum in–trail separation 3Approach procedures todependent parallel runways (3c)Current procedures • The Baseline IFR Approach
3Approach procedures to dependent parallel runways (4a)Innovative procedures • HALS/DLT or Staggered Approach k Hik0 i 1700ft Sik0
3Approach procedures to dependent parallel runways (4b)Innovative procedures • HALS/DLT or Staggered Approach Runway lightingsystem Source (OPTIMAL, EUROCONTROL, 2005)
Increasing of the vertical separation Hik0 in timeif: vi > vk sink/sin i k > I k Hik0 i < 4300 ft i Sik0 k 3Approach procedures to dependent parallel runways (5a)Innovative procedures • Steeper Approach (SAP)
3Approach procedures to dependent parallel runways (5b)Innovative procedures • Baseline ILS vs Steeper Approach (SAP) ILS Glide Slope 5.5° ILS Glide Slope 3° (Source: Airliner World, 2006)
3Approach procedures todependent parallel runways (4a)Innovative procedures Currently certificated aircraft fleet for SAP • De Havilland DHC-6, - 8 (STOL - Short Take- Off and Landing); • Cessna Citation, Embraer ERJ 135, 170; • Airbus A319. Certificaation should provide: • The aircraft capability to use a range of GS angles (30- 50 or 60); • Certainly increase in the approach speed to compensate higher descent speed and consequent increase in the wake vortex.
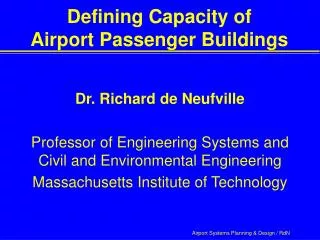
4Modelling the capacity of dependent parallel runways (1) The concept and definition: • The maximum number of aircraft operations accommodated during given period of time (1 or ¼ of an hour) under conditions of constant demand for service; (VMC (VFR) and/or IMC (IFR) at the US and only IMC (VFR) at European airports). State of the art of modelling: • Analytical models (Blumstein, Haris, Janic, Tosic); • Simulation models (SIMMOD, TAAM, Airport Machine).
4Modelling the capacity of dependent parallel runways (2) Objectives: • Developing the dedicated analytical model for ILS baseline, HALS/DLT, and SAP; • Carrying out the sensitivity analysis with respect to the most influencing factors.
4Modelling the capacity of dependent parallel runways (3) Assumptions: • The geometry of parallel runways is known; • The runways operate according to given degree of dependency – the arriving aircraft use ILS (Instrumental Landing System); • The ATC applies longitudinal, lateral-diagonal, and vertical distance-based separation rules between arriving and time-based separation rules between departing aircraft; • Successive operations are carried out alternatively on each runway; • Only the certificated aircraft can perform SAP; • The aircraft appear at particular parts of the runway system when the ATC expects them.
EI, EJ, Ek - final approach gate of aircraft i, j and k, respectively T I/J, Tk - landing threshold of aircraft i, j and k, respectively I, J, k - length of common approach path of aircraft i, j and k, respectively d - spacing between RWY 1 and RWY 2 lIJ(*)- initial longitudinal ATC separation rules between aircraft i and j SIk0, SkJ0 - initial longitudinal “spacing” between aircraft ik and kj, respectively I, J lIJ(*) i j EI/J RWY 1 TI/J kJ Ik d k Ek RWY 2 Tk SIk0 SkJ0 z k 4Modelling the capacity of dependent parallel runways (4) The model for arrivals – basic geometry • Sequence ij – longitudinal separation • Sequences ik and kl–diagonal or vertical separation Horizontal plane
Low - j j F HHL0 H0ik k High - k E D C H0ik Hij0 A i Low - i B HL= Ltg H/k L/i Runway(s) TH TL EI/L zLH zLH E1/ij Runway(s) TL,TH k-i/j L ZLH SkJ0 SIk0 i/j H k 4Modelling the capacity of dependent parallel runways (5) The model for arrivals – basic geometry Vertical plane - HALS/DLT (S-F-F) Vertical plane – SAP (F-S-S)
4Modelling the capacity of dependent parallel runways (6) The model for arrivals – basic formulas: • The inter-arrival times at the threshold of RWY1 and RWY2atij/k = atik + atkj and atkl/j = atkj + atjl • uij, uik, ukj, ujl are the control variables
4Modelling the capacity of dependent parallel runways (7) The model for arrivals – basic formulas: • The probability of occurrence of strings of aircraft types ikj and kjl • The average inter-arrival times at RWY1 and RWY2 • The ultimate arrival capacity of RWY1 and RWY2
4Modelling the capacity of dependent parallel runways (8) Mixed operations • Realising (m) departures between the arrivalskj • Probability of occurrence of the gap between the successive paired arrivals ik and jl is pdm • The capacity Departures • The inter-departure times: • The average inter-departure time: • The departure capacity:
Passenger Terminal complex New runway Cargo Terminal complex Apron 25R Apron 18 25L 07L 26L 07R Runways Taxiways New runway Preferred landing direction Preferred take-off direction 5Application of the model (1a) Input: Frankfurt airport- geometry of runways HALS/DLT vs Baseline ILS • Two parallel runways – 4000m (07 L/R and 25 L/R) for landingsand take-offs; • Separation distance:d = 1700 ft (518 m) • RWY 26L – 2500 mfor landings; • Staggered distance:z = 1500 m • RWY 18 – 4500m only for take-offs;
5Application of the model (2a) HALS/DLT vs Baseline ILS Input: Frankfurt airport – fleet characteristics
5Application of the model (3a) HALS/DLT vs Baseline ILS Input: Frankfurt airport - The ATC separation rules a) Arrivals (nm) b) Departures (min) = 2 nm H( .) = 1000 ft – Lateral/diagonal: – Vertical:
5Application of the model (4a) HALS/DLT vs Baseline ILS Input: Frankfurt airport- Scenario of using runways • RWY 25R/L - 26L are used for landings(Baseline ILS and HALS/DLT) and mixed operations; • RWY 18 is used exclusively for take-offs; • The ATC applies longitudinal, lateral-diagonal and vertical separation rules between landings; • The ATC tactics is FIFO (First-In-First-Out).
5Application of the model (5a) HALS/DLT vs Baseline ILS Results: Frankfurt airport a) HALS/DLT vs ILS Baseline Capacity: > 18 % b) HALS/DLT vs ILS Baseline (A380–10%) Capacity: > 27%
5Application of the model (6a) HALS/DLT vs Baseline ILS Results: Frankfurt airport • HALS/DLT (A380– 10%)Capacity: < 6 -25 %
N 1R 1L 28R 28L Arrivals Departures 5Application of the model (1b) Steeper Approach (SAP) vs Baseline ILS Input:San Francisco International Airport (SFO) - geometry of runways • Two pairs of parallel runways: 1 L/R and 28 L/R(1L/28R – 3600 m;1R/28L – 3200 m) • Separation distance:d = 750 ft (229m)
5Application of the model (2b) Steeper Approach (SAP) vs Baseline ILS Input: SFO - Fleet characteristics
5Application of the model (3b) Steeper Approach (SAP) vs Baseline ILS Input: SFO – The ATC separation rules a) Arrivals (nm) b) Departures (min) – Vertical:H(.) = 1000 ft – Lateral/diagonal – as in a)
5Application of the model (4b) Steeper Approach (SAP) vs Baseline ILS • The pair of runways 28 L/R is used exclusively for landings; • The runways 1L/1R are used exclusively for taking- offs; • The ATC applies longitudinal, lateral-diagonal and vertical separation rules between landings; • Only small aircraft can perform SAP (Scenario 1); • All except heavy aircraft can perform SAP (Scenario 2); • The ATC tactics is FIFO (First-In-First-Out). Input: SFO – Scenario(s) of using runways
5Application of the model (5b) Steeper Approach (SAP) vs Baseline ILS Results: SFO airport • SAP vs ILS IMC baseline: • SAP - Scenario 1Landing capacity > 27% • SAP - Scenario 2Landing capacity > 83 %
Safety: Standard vertical and in-trail wake-vortex separation; Switching between RWY lighting system modes; Insufficient length of RWY with DLT 6Qualitative evaluation (1) The HALS/DLT Environment: • Shifting noise contours towards the airport; • Neutrality regarding extra fuel burn and air pollution. Requirements: • Wake vortex warning system; • Additional ILS for DLT
Safety: 6Qualitative evaluation (2) The SAP Requirements: • Not standardised procedure; • DH altitude need to be redefined due to the higher descent speed; • ILS GS interception might be affected due to the high aircraft energy; • Switching between the RWY lighting system modes (needs calibration if possible for two ILS GS angles). • Two pairs of ILS or GNSS per runway; • Aircraft certification (mightbe very expensive); • Pilots’ training. Environment: • Could contribute to reducing noise due to the higher flight paths.
7 Conclusions • The HALS/DLT and SAP have potential for increasing of the capacity of closely spaced parallel runways under IMC; • The HALS/DLT does not have the specific requirements except additional ILS and sufficient length of RWY with DLT; • The SAP requires (maybe rather expensive) certification of aircraft, additional ILSs (GNSS), and pilot training; • The capacity model provides good results (HALS/DLT); it should be checked for SAP)
8 The lessons learnt • The wake-vortex remains the main barrier to increasing of the airport runway capacity; • The remaining questions are: • Why the wakes are considered in one way under VMC and in other under IMC?; • Why the vertical dimension of the airspace has not been considered more frequently to mitigate the wakes problem both in the previous and prospective (future long-term) concepts (TECAC)?; • Should the vehicles – aircraft become more active part of the game – the airports and ATC have already done a lot??