Download
1 / 14
140 likes | 291 Vues
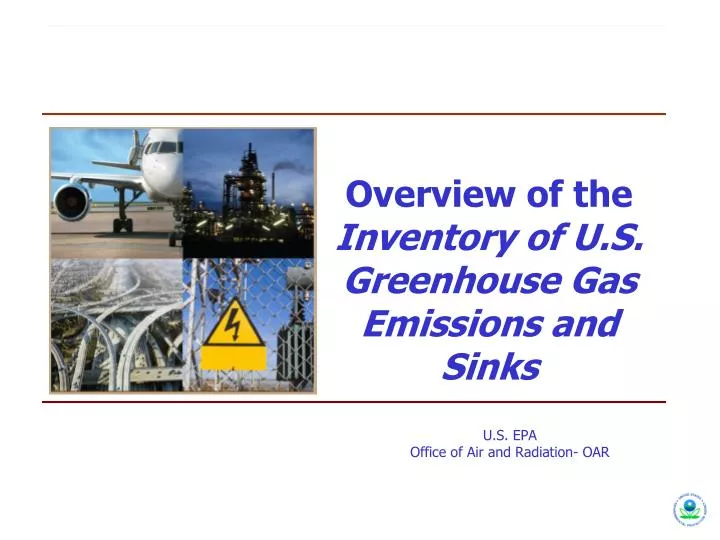
Overview of the Inventory of U.S. Greenhouse Gas Emissions and Sinks. U.S . EPA Office of Air and Radiation- OAR. U.S. Greenhouse Gas Inventory Background. The U.S. Government annually submits a national GHG Inventory Report This is the official U.S. government GHG Inventory

E N D
Overview of theInventory of U.S. Greenhouse Gas Emissions and Sinks U.S. EPA Office of Air and Radiation- OAR
U.S. Greenhouse Gas Inventory Background • The U.S. Government annually submits a national GHG Inventory Report • This is the official U.S. government GHG Inventory • Meets U.S. commitments under the UNFCCC • Impartial and policy-neutral • Interagency effort led by EPA • Data and input provided by DOE, USDA, DOT, DOD, the State Department, and others • Open for 30 day public review and comment period • As well as “peer review” targeted at technical audience • International peer review through the UNFCCC
GHG Inventory Compilation Process • Unlike criteria pollutant inventory (i.e., NEI), GHG emissions are not collected from States for use in national GHG inventory • U.S. GHG emissions calculated using internationally-accepted methods and appropriate statistics and data for national-level GHG estimates • Calculation methods have also served as basis for mandatory GHG reporting rule for facility-level calculations of emissions from large entities • In order to provide complete coverage, often aggregated national statistics are used • Focus of GHG inventory is to account for all U.S. GHG emissions across all emitting sources • Example: Total fuel use in U.S. economy provided by DOE’s Energy Information Administration, which is utilized to estimate total U.S. GHG emissions from fuel combustion
General, Basic Methodologies Emissions = Activity Data × Emission Factor Activity data is generally from national level statistics e.g., CO2 from Fossil Fuel Combustion: based on fuel consumed Fuel consumption collected and aggregated to national level by EIA Based on EIA surveys and EIA definitions of sectors e.g., CO2 from Iron & Steel Production: based on national production statistics Coal and coke consumption from EIA; coke consumed for pig iron production and scrap steel consumption from AISI; iron ore consumption in sinter production from USGS Emission factors can be mix of IPCC default and country-specific e.g., CO2 from Fossil Fuel Combustion: based on fuel-specific carbon content analyses conducted by EIA (coal, petroleum, natural gas) Non-CO2 from IPCC e.g., CO2 from Iron & Steel Production: based on mix of factors Pig iron and crude steel carbon contents from IPCC Electric arc furnace carbon anodes from DOE
“Basic” Methodology Improvements Improvement over IPCC methods by using country-specific information known about a source e.g., CH4 from Coal: IPCC method combines separate calculations from underground mines, surface mines, and post-mining emissions EPA-industry voluntary partnership to reduce emissions from mine methane venting Data provided by partnerships combined with IPCC method for final estimate e.g., SF6 from Electrical Transmission: combines IPCC method with detailed partnership information EPA-industry voluntary partnership to reduce emissions Industry partners provide usage data since 1999 Developed proxy methodology as data missing from 1990 to 1998
EPA Source-Specific Model • “Vintaging Model” • Tracks turnover in equipment containing ODSs based on estimates of historical equipment and material (e.g., foams) stocks • Simulates replacement of ODSs in equipment over time with substitute chemicals including HCFCs, HFCs, PFCs, and SF6 • “Landfill Model” • First order decay model with CH4 generation coefficients, based on empirical measurements, are applied to waste in place data • CH4 emissions are adjusted for gas recovery for energy, additional CH4 generation in industrial landfills, and CH4 oxidation • Enteric Fermentation • Model of livestock populations by animal type and age group applied to CH4 conversion factors • Agricultural Soil Management • Model uses fertilizer consumption data combined with N2O emission factors for fertilizer use on agricultural soils
Limitations of U.S. GHG Inventory • National-level totals for entire U.S. • Data for most sources is very aggregated with little to no geographic scope inside U.S. • Difficult to reconcile with criteria pollutant inventories • Which include source-specific data necessary to model emissions (e.g., state, county, latitude & longitude) • Coverage has been determined by Framework Convention • Still must use SAR GWP values (not TAR or new AR4) • Defers to Montreal Protocol on ODS (which have high GWPs) • Impact of “indirect GHGs” and aerosols • Contribution of individual countries to world total limited to Annex I vs. Non-Annex I requirements
Limits of U.S. GHG Inventory (continued) • U.S. GHG Inventory accounts for all GHG emissions in a particular year across the entirety of the United States • Needed overview of total U.S. GHG emissions across all sources, in combination with MRR rule which will provide greater detail on individual emitters • Alternate ways to look at U.S. GHG emissions have been developed • EPA • OTAQ “Fact Sheet” focusing on detailed analysis of transportation sector; RFS analyses • OSWER “Opportunities to Reduce GHG Emissions through Materials and Land Management Practices” - Lifecycle approach to assign emissions to goods and materials • USDA focus on agricultural sector; DOT report on transportation sector • Interest groups focusing on GHGs from buildings, specific sectors, etc. • U.S. GHG Inventory remains a transparent way to present overall U.S. emissions • Policy-neutral: “Factual, historic snapshot” of U.S. GHG emissions • Emissions calculated and presented consistently with other countries
United Nations Framework Convention on Climate Change • The UN Framework Convention on Climate Change “sets an overall framework for intergovernmental efforts to tackle the challenge posed by climate change” • Adopted in 1992 • Signed and ratified by the U.S. in 1992 • Ratified by 192 countries • Annex I • Industrialized nations (and EIT) • Non-Annex I • Developing countries • Under the UNFCCC, governments: • “Gather and share information on greenhouse gas emissions, national policies and best practices” • GHG inventories are considered mechanisms to compare relative contributions
Inventory Reporting under the UNFCCC • All Annex I countries are required to report annual emissions and sinks of greenhouse gases to the UNFCCC Secretariat • 40 Annex I countries (+ European Commission) • Annual inventory required under the UNFCCC since 1994 • Anthropogenic sources and sinks • CO2, CH4, N2O, HFCs, PFCs, SF6 • Weighted using “Global Warming Potential” • Include “indirect GHGs” for informational purposes: ozone precursors (CO, NOx, NMVOCs) & SO2 • Calculated using consistent and comparable methodologies
IPCC Methodologies • IPCC guidelines/guidance provide broad international calculation methods: • List of emission source types and a compendium of information on methods and factors for the estimation of emissions • Step-by-step directions for assembling, documenting and transmitting national inventory data consistently • Assists development of inventories that are transparent, documented, consistent over time, complete, comparable, assessed for uncertainties, subject to quality control and quality assurance, and efficient in the use of resources
IPCC Methodologies (II) • IPCC guidelines divided into sectors: • Energy = emissions of all greenhouse gases resulting from stationary and mobile energy activities including fuel combustion and fugitive fuel emissions • Industrial Processes = by-product or fugitive emissions of greenhouse gases from industrial processes not directly related to energy activities (not fuel combustion) • Solvent and Other Product Use = emissions that are produced as a by-product of various solvent and other product uses • Agricultural = anthropogenic emissions from agricultural activities (except fuel combustion) • Land Use, Land-Use Change and Forestry = emissions and removals of CO2 from forest management, other land-use activities, and land-use change • Waste = emissions from waste management activities
Resources • Copies of latest Greenhouse Gas Inventory • Full Report available in late fall • Stand-along Executive Summary available soon • “Fast Facts” tabular summary available • Printed copies up front! • Electronically download • http://www.epa.gov/climatechange/emissions/usinventoryreport.html • UNFCCC and IPCC Greenhouse Inventories Programme • unfccc.int • www.ipcc.ch