Download
1 / 37
370 likes | 469 Vues
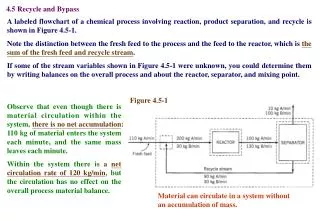
Does the U.S. Feed the World?. Economic Research Service U.S. Department of Agriculture. http://res.heraldm.com/content/image/2010/11/04/20101104001209_0.jpg. World Cereal Production (2004). http://fatknowledge.blogspot.com/2008/06/food-production-around-world.html.

E N D
Does the U.S. Feed the World? Economic Research Service U.S. Department of Agriculture
http://res.heraldm.com/content/image/2010/11/04/20101104001209_0.jpghttp://res.heraldm.com/content/image/2010/11/04/20101104001209_0.jpg
World Cereal Production (2004) http://fatknowledge.blogspot.com/2008/06/food-production-around-world.html
Animal Feed: 40% of Global Grain Production(70% of U.S. Grain Produciton) Animal Feed Demand http://www.fao.org/docrep/007/y5019e/y5019e08.jpg
World Meat Production (2004) http://fatknowledge.blogspot.com/2008/06/food-production-around-world.html
Livestock Revolution http://whereareyougoingtimorleste.files.wordpress.com/2008/04/blog5.jpg
World Fruit and Vegetable Production(2004) http://fatknowledge.blogspot.com/2008/06/food-production-around-world.html
U.S. food imports 2003(Total: $45.7 Billion) • Horticultural products • $23.2 Billion • Animals, animal products • $8.6 Billion • Coffee, cocoa, rubber • $5.3 Billion • Grains and feeds • $3.9 Billion • Sugar, tobacco • $2.8 Billion • Oilseeds, oilseed products • $2.0 Billion http://www.elements4health.com/images/stories/food/bananas.jpg
Value of U.S. agricultural imports, ranked by country Fiscal year Growth Country 2000 2001 2002 2003 2000-03 (billion U.S.$) Percent European Union 8.3 8.1 8.7 10.3 5.7% Canada 8.5 9.5 10.2 10.3 4.7% Mexico 5.0 5.3 5.3 6.0 4.7% Australia 1.5 1.8 1.9 2.0 6.8% Brazil 1.2 1.0 1.1 1.5 4.1% New Zealand 1.1 1.2 1.2 1.3 3.9% Chile 1.0 1.0 1.1 1.2 5.4% China, mainland 0.8 0.8 1.0 1.2 9.9% Indonesia 1.0 0.9 0.9 1.2 3.7% Colombia 1.2 1.0 0.9 1.0 -3.0% World 38.9 39.0 41.0 45.7 1.5% Source: Economic Research Service, USDA and the Census Bureau, U.S. Department of Commerce. Who does the U.S. Import food from?
U.S. Food Exports 2003(Total: $56.2 Billion) • Grain, grain products • $14.8 Billion • Animals, animal products • $11.9 Billion • Oilseeds, oilseed products • 10.2 Billion • Fruits, nuts, juice, wine • $6.3 Billion • Sugar, tropical products • $4.3 Billion • Cotton, tobacco • $3.9 Billion • Vegetable Products • $1.3 Billion
Value of U.S. agricultural exports, ranked by country Fiscal year Growth Country 2000 2001 2002 2003 2000-03 (billion U.S.$) Percent Canada 7.5 8.0 8.6 9.1 5.0% Japan 9.3 8.9 8.3 8.8 -1.3% Mexico 6.3 7.3 7.1 7.6 4.8% European Union 6.5 6.5 6.5 6.3 -0.6% China, mainland 1.5 1.9 1.8 3.5 24.2% South Korea 2.5 2.5 2.7 2.8 2.2% Taiwan 2.0 2.0 1.9 1.9 -0.7% Hong Kong 1.2 1.3 1.1 1.1 -4.0% Indonesia 0.7 0.9 0.8 0.9 8.0% Turkey 0.7 0.6 0.7 0.9 5.8% World 50.7 52.7 53.3 56.2 2.6% Source: Economic Research Service, USDA and Census Bureau, U.S. Department of Commerce. Imports Who does the U.S. Export food to?
U.S. Produces 44% of World’s Corn http://www.grains.org/galleries/default-image/WorldCornProd06.jpg
Global Maize Production http://wps.prenhall.com/wps/media/objects/264/270834/global%20distribution%20of%20maize.GIF
U. S. is world’s largest corn exporter20% of U.S. corn exported http://www.grains.org/galleries/default-image/WorldCornExporters06.jpg
Japan is the largest importer of U.S. Corn http://pierstransportation.files.wordpress.com/2012/09/top-markets-for-us-corn-exports.jpg?w=450
Corn use in the U.S. http://blog.ucsusa.org/wp-content/uploads/2012/07/Graph-from-Jeremy-Corn-use-2000-2011.png
World Wheat Production Total U.S. Production: 57,000,000 MT (2006) Total World Production: 593,000,000 MT (2006) http://www.gramene.org/species/triticum/images/percentyieldwheat.jpg
U.S. Wheat Exports (2006: 48% of U.S. wheat exported) U.S. is world’s largest wheat exporter: 24% of market http://www.ers.usda.gov/AmberWaves/June08/Indicators/Charts/Indicator_smallfig03.gif
Rice • Total World Rice Production: • 588,563,933 MT • Total U.S. Rice Production: • 9,033,610 MT
Global Rice Production http://www.irri.org/gis/ricedist/maps/rice_world_2005.png
U.S. grows 39% of world’s soybeans 39% http://photos.mongabay.com/07/sa_soy-600.jpg
Top Ten U.S. Export Customers $ Million SoybeanExports Soybean OilExports Soybean MealExports China Mexico Canada $82 $2,889 $242 Canada Mexico European Union-15 $72 $1,114 $150 Mexico Cuba Indonesia $50 $981 $96 China Australia Japan $48 $957 $83 Egypt Dominican Republic Taiwan $27 $419 $73 Japan Indonesia Korea $21 $324 $61 India Philippines Korea $21 $282 $57 Turkey Thailand Peru $19 $181 $44 Iraq Venezuela Canada 14 $158 $40 Algeria Turkey Turkey 13 $91 $39 All Others All Others All Others $188 $583 $304 Total Total Total $556 $7,980 $1,189 Soy Exports(2003:$6.5 Billion Dollars) 50% of U.S. soy is exported
Global Cattle Production http://img181.imageshack.us/img181/1497/screenhunter3at7.jpg
World: 1.3 billion cattle: projected to double by 2050 http://images.wri.org/drylands_map05.gif
India • World’s top producer of milk and dairy products • Poultry meat production has tripled • Last decade • Many moved away from strict vegetarian diet • Fast foods http://www.peta.org.uk/page/skins/l2-indiancows.jpg
Global Chicken Production http://www.ilri.org/ilripubaware/uploaded%20files/Global%20Chicken%20Density.jpg
China China: leads world in meat production and consumption #1 in pork, mutton, eggs, aquaculture #2 in poultry, #3 Beef Must import feed to support pig, poultry industry Still a net exporter of feed Last decade Production up 2x per capita consumption up 3x Pork: 66% of meat consumed China Pork Market http://www.mir.com.my/rb/photography/companies/nikon/nikkoresources/AFNikkor/AF2450mm/market_china.jpg
Global Hog Production http://strangemaps.files.wordpress.com/2007/01/hogs.gif