Download
1 / 18
180 likes | 267 Vues
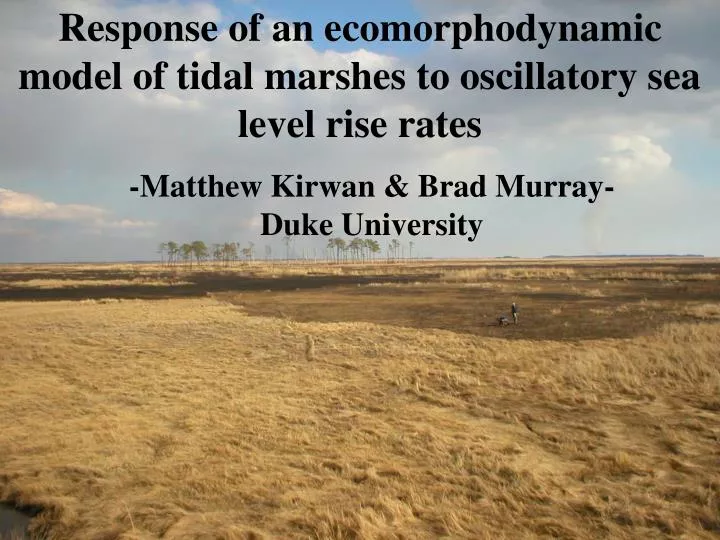
Response of an ecomorphodynamic model of tidal marshes to oscillatory sea level rise rates. -Matthew Kirwan & Brad Murray- Duke University. Assumed equilibrium (Long term accretion = SLR) Unchanging accretion rate, depth, channel density H ow long between equilibrium states?

E N D
Response of an ecomorphodynamic model of tidal marshes to oscillatory sea level rise rates -Matthew Kirwan & Brad Murray- Duke University
Assumed equilibrium (Long termaccretion = SLR) Unchanging accretion rate, depth, channel density How long between equilibrium states? How far out of equilibrium? How dynamic?
(kilometers and decadal-millennial time scales) Model Approach Cellular bed surface flooded and drained by tidal flow containing fine sediment Basic transport processes influenced by vegetation builds 3D marsh topography
Sedimentary Processes Deposition rate = (k1*SSC + k2*Biomass)*Depth, k1=.0135, k2=.000015 Erosion rate Slope driven transport (diffusion, slumping) (Morris et al., 2002) Suspended sediment concentration m= 1.4-3 kg/m2 sec (Fagherazzi and Furbish, 2001) = (k * slope) (Murray and Paola, 2002) where k is inversely related to biomass
Production (g/m3/yr) 0.5 1 1.5 2 2.5 3 Depth below high tide (m) Vegetation Treatment Calculate biomass in each cell with productivity function (Morris, 2002) Increased inundation Increased biomass Increased deposition rates
water depth 2m 4m 3m No vegetation Vegetation 1 mm/yr Shallower platform Less extensive channel network Steep, abrupt channel edges
water depth 2m 4m 3m Accelerated Sea Level Rise: Vegetated 1 mm/yr 10 mm/yr Platform depths increase Velocity, erosion rates increase Channels deepen, expand slightly
Accelerated Sea Level Rise: Unvegetated 1 mm/yr 10 mm/yr (eq. depths subtidal) Channel density infinity • Removal of vegetation productivity feedback • Lack of plants to constrain creek bank slump
Oscillating instead of abrupt changes in rate of sea level rise (moving forcing term) Sea level rate approximated by sin function Experiments with varying period and amplitude of oscillation Track accretion, vegetation, and channel changes
SLRR < AR accretion (depth dec) SLRR > AR sea level (depth inc) • SLRR exceed AR: water depth • Accretion α depth: AR • Platform always adjusting depth to continuously changing SLR rate, causing accretion lag and phase shift
too shallow too deep More out of phase with smaller period Physical reason for lag Forcing term always moving, so never get to equilibrium
Amplitude of SL Rate oscillation has no effect on lag • Need bigger depth change • to accommodate bigger sea • level rate change, • But deepening occurs faster • Amplitude of accretion smaller than sea level rise rate
Channel network and biomass change expanding tidal prism Oak Island. Near Cape Fear, NC
Channel Network and Biomass Change Channel Biomass Depth Biomass proportional to depth (never exceed optimum depth) Channel network expansive when platform depths are shallow Effects of biomass win over effects of expanding tidal prism!
Sea Level Rate and Accretion Rate 970 – 1970 AD • Inferring sea level rise rates from accretion rates complicated • Today’s Sea level rates > Accretion rates • not indicative of a marsh unable to “keep up”
Acknowledgements Jim Morris, University South Carolina Lincoln Pratson, Duke University Andrew W. Mellon Foundation
Case Study One Donnelly et al., 2004 • SLR rate: 1 mm/yr to 2.5 mm/yr in late 19th century • Coincides with increased global temperatures • Are marsh accretion rates accurate indicators of sea level history? • How would lag effect timing of acceleration?
Case Study Two Many authors note long-term AR < SLRR, and infer marsh will be lost. 210Pb (1850-present) Would expect SLRR > AR in a normal, healthy marsh whenever SLRR has increased