Download
1 / 19
220 likes | 380 Vues
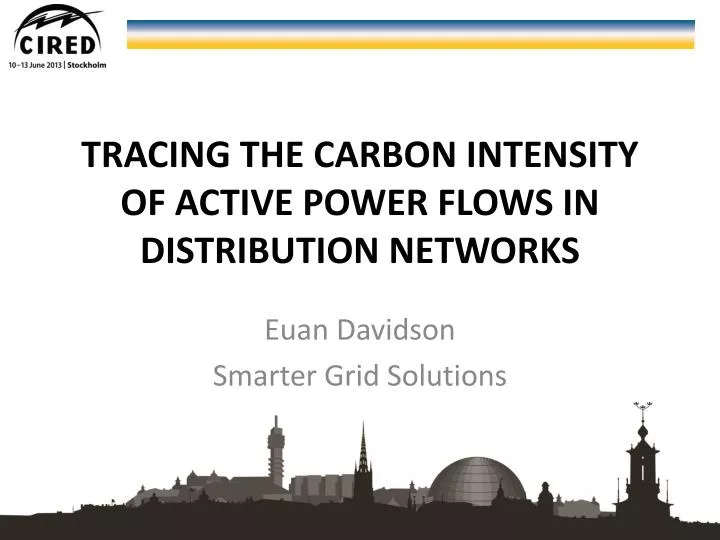
Tracing the CARBON intensity of active power flows in distribution networks. Euan Davidson Smarter Grid Solutions. http://www.bbc.co.uk/news/uk-scotland-21966678. ~11% of kWh met by renewables (UK). Equivalent of 39% of kWh met by renewables (Scotland).

E N D
Tracing the CARBON intensity of active power flows in distribution networks Euan Davidson Smarter Grid Solutions
~11% of kWh met by renewables (UK) Equivalent of 39% of kWh met by renewables (Scotland) Equivalent 5% of kWh met by renewables (South West)
CarbonIntensity of Electricity • DEFRA in the UK sets figures for the carbon emissions associated with energy produced by different types of generation • Carbon intensity – kgCO2/kWh
UK Macro CarbonIntensity Derived from BM Reports data with kind permission of Elexon
Zonal CarbonIntensity Derived from BM Reports data with kind permission of Elexon
Local CarbonIntensity • What is the effect of DG and Demand at a local level? • What is the effect of the infrastructure and network flows? • Where does my electricity come from? • How green is it?
Proportional Sharing Principle 30MW 20MW Infeed 2 Infeed 1 40% from Infeed 1 60% from Infeed 2 40% from Infeed 1 60% from Infeed 2 30MW 20MW
Tracing: NumericalMethod • Bialek’s method [Bialek 96]exploits linear algebra: - vectors of nodal flows - vectors of branch flows - upstream and downstream distribution factors - vector of injections from generation - vector of loads The directed graph is described using: - incidence matrix - incidence matrix with 1 removed - incidence matrix with -1 removed
Tracing: NumericalMethod The proportion of nodal flows can be equated to load or generation: and can be formed from , , and By inverting and we can get distribution factors in terms of loads/generators:
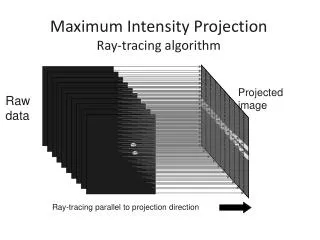
CarbonTracing: Algorithm Run Load Flow/Estimate State Build Directed-graph of Network Flows Generate Incidence matrix from Graph Split Incidence matrix Solve Allocate Emissions to flows/loads/Losses
Carbon-intensity of Power Flow 300MW 200MW 78MW 114MW 222MW 164MW 62MW 103MW 400MW Normalised carbon-intensity [g/kWh] Total amount of carbon [kg/h]
Carbon-intensity of Losses MW losses [MW/h] Total amount of carbon [kg/h]
Understand the effect of generation and demand on carbon-intensity in the South West • A tool for Public Engagement? • See our video: http://www.smartergridsolutions.com