Download
1 / 1
10 likes | 104 Vues
Horizon Partitioning of Soil CO 2 Sources and their Isotopic Composition ( 13 C) in a Pinus Sylvestris Stand. Goffin Stéphanie (1), Parent Florian (2, 3), Plain Caroline (2, 3), Maier Martin (4) , Schack-Kirchner Helmer (4), Aubinet Marc (1), Longdoz Bernard (2, 3).

E N D
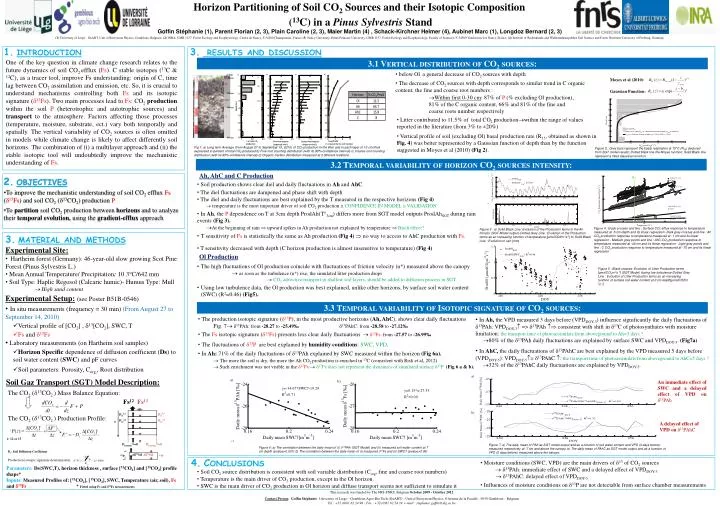
Horizon Partitioning of Soil CO2 Sources and their Isotopic Composition (13C) in a Pinus Sylvestris Stand Goffin Stéphanie (1), Parent Florian (2, 3), Plain Caroline (2, 3), Maier Martin (4) , Schack-Kirchner Helmer (4), Aubinet Marc (1), Longdoz Bernard (2, 3) (1) University of Liege - GxABT, Unit of Biosystem Physics, Gembloux, Belgium (2) INRA, UMR 1137, Forest Ecology and Ecophysiology, Centre de Nancy, F-54280 Champenoux, France(3) Nancy University, Henri Poincare University, UMR 1137, Forest Ecology and Ecophysiology, Faculty of Sciences, F-54500 Vandoeuvre les Nancy, France.(4) Institute of Bodenkunde and Waldernährungslehre Soil Science and Forest Nutrition University of Freiburg, Germany introduction results and discussion One of the key question in climate change research relates to the future dynamics of soil CO2 efflux (Fs). C stable isotopes (13C & 12C), as a tracer tool, improve Fs understanding: origin of C, time lag between CO2 assimilation and emission, etc. So, it is crucial to understand mechanisms controlling both Fs and its isotopic signature (13Fs). Two main processes lead to Fs: CO2production within the soil P (heterotrophic and autotrophic sources) and transport to the atmosphere. Factors affecting those processes (temperature, moisture, substrate, ect.) vary both temporally and spatially. The vertical variability of CO2 sources is often omitted in models while climate change is likely to affect differently soil horizons.The combination of (i) a multilayer approach and (ii) the stable isotopic tool will undoubtedly improve the mechanistic understanding of Fs. 3.1 Vertical distribution of CO2 sources: • objectives • To improve the mechanistic understanding of soil CO2 efflux Fs (13Fs) and soil CO2 (13CO2) production P • To partition soil CO2 production between horizons and to analyze their temporal evolution,using the gradient-efflux approach • below Ol, a general decrease of CO2 sources with depth 2.5cm Ol 0 cm • The decrease of CO2 sources with depth corresponds to similar trend in C organic content, the fine and coarse root numbers : Ah -20 cm • Within first 0-30 cm: 87% of P (% excluding Ol production), 81% of the C organic content, 66% and 81% of the fine and coarse roots number respectively AhC -40 cm C • Litter contributed to 11.5% of total CO2 productionwithin the range of values reported in the literature (from 3% to ±20%) Moyes et al (2010): • Vertical profile of soil (excluding Ol) basal production rate (R15, obtained as shown in Fig. 4) was better represented by a Gaussian function of depth than by the function suggested in Moyes et al (2010) (Fig 2). -80 cm Gaussian Function: Fig 1: a) Long term Average (from August 27 to September 15, 2010) of CO2 production in the litter and in each layer of 10 cm-thick expressed in percent of total CO2 produced b) Fine root counting distribution (with its 95%-confidence interval) c) Coarse root counting distribution (with its 95%-confidence interval) d) Organic Carbon distribution measured at 2 different locations. Figure 2 : Grey bars represent the basal respiration at 15°C (R15) deduced from SGT model results; Dotted black line the Moyes function; Solid Black line represent a fitted Gaussian function. material and methods • Experimental Site: • Hartheimforest (Germany): 46-year-old slow growing Scot Pine Forest (PinusSylvestris L.) • MeanAnnualTemperature/ Precipitation: 10.3°C/642 mm • Soil Type: HaplicRegosol (Calcarichumic)- Humus Type: Mull • High sand content 3.2 Temporal variability of horizon CO2 sources intensity: Ah, AhC and C Production R15 • Soil production shows clear diel and daily fluctuations in Ah and AhC. • The diel fluctuations are dampened and phase shift with depth • The diel and daily fluctuations are best explained by the T measured in the respective horizons (Fig 4) • temperature is the most important driver of soil CO2 production CONFIDENCE IN MODEL VALIDATION Experimental Setup:(see Poster B51B-0546) • In Ah, the P dependence on T at 3cm depth ProdAh(T°3cm) differs more from SGT model outputs ProdAhSGT during rain events (Fig 3). • At the beginning of rain upward spikes in Ah production not explained by temperature Birch effect? • In situ measurements (frequency = 30 min) (From August 27 to September 14, 2010) • Vertical profile of [CO2] , 13[CO2], SWC, T • Fs and 13Fs • Laboratory measurements (on Hartheim soil samples) • Horizon Specific dependence of diffusion coefficient (Ds) to soil water content (SWC) and pF curves • Soil parameters: Porosity, Corg,, Root distribution Figure 4 : black crosses and line : Surface CO2 efflux response to temperature measured at -5 cm depth and its linear regression -Dark grey crosses and line : Ah CO2 production response to temperature measured at -1 cm and its linear regression - Medium grey points and line : AhC CO2 production response to temperature measured at -40 cm and its linear regression - Light grey points and line : C CO2 production response to temperature measured at -70 cm and its linear regression Figure 3 : a) Solid Black Line: Evolution of the Production terms in the Ah horizon (SGT Model output)-Dotted Grey Line : Evolution of the Production terms as an increasing function of temperature [µmolCO2m-2s-1] b) Solid Black Line : Evolution of rain [mm] • T sensitivity of Fs is statistically the same as Ah production (Fig 4) no way to access to AhC production with Fs. Fs13 Fs12 • T sensitivity decreased with depth (C horizon production is almost insensitive to temperature) (Fig 4) Ol Production Fi112 Fi113 • The high fluctuations of Ol production coïncide with fluctuations of friction velocity (u*) measured above the canopy • as soon as the turbulence (u*) rise, the simulated litter production drops • CO2 advective transport in shallow soil layers, should be added to diffusion process in SGT Fi212 Fi213 Figure 5 : Black crosses: Evolution of Litter Production terms [µmolCO2m-2s-1] (SGT Model) during low turbulence-Dotted Grey Line : Evolution of Litter Production terms as an increasing function of surface soil water content at 0 cm depth[µmolCO2m-2s-1] • Using low turbulence data, the Ol production was best explained, unlike other horizons, by surface soil water content (SWC) (R2=0.46) (Fig5). Fbottom12=0 Fbottom13=0 • Soil Gaz Transport (SGT) Model Description: The CO2 (13CO2 ) Mass Balance Equation: z1 3.3 Temporal variability of Isotopic signature of CO2 sources: ∆C12/∆t ∆C13/∆t 12Pz 13P z2 • The production isotopic signature (13P), in the most productive horizons (Ah, AhC), shows clear daily fluctuations • Fig. 7 13PAh: from -28.27 to -25.49‰ 13PAhC: from -28.58 to -27.12‰ • In Ah, the VPD measured 3 days before (VPDDOY-3) influence significantly the daily fluctuations of 13PAh: VPDDOY-3 => 13PAh consistent with shift in 13C of photosynthates with moisture limitation: the transport time of photoassimilats from aboveground to Ah=3 days ? • 80% of the 13PAh daily fluctuations are explained by surface SWC and VPDDOY-3. (Fig7a) The CO2 (13CO2 ) Production Profile: • The Fsisotopic signature (13Fs) presents less clear daily fluctuations 13Fs: from -27.57 to -26.99‰ • The fluctuations of 13P are best explained by humidity conditions: SWC, VPD. • In AhC, the daily fluctuations of 13PAhC are best explained by the VPD measured 5 days before (VPDDOY-5): VPDDOY-5= 13PAhC :the transport time of photoassimilats from aboveground to AhC=5 days ? • 32% of the 13PAhC daily fluctuations are explained by VPDDOY-5. • In Ah: 71% of the daily fluctuations of 13PAh explained by SWC measuredwithin the horizon (Fig 6a). • The more the soilis dry, the more the Ah CO2 production isenriched in 13C (consistent withRisk et al, 2012) • Suchenrichmentwas not visible in the 13Fs 13Fs does not represent the dynamics of simulated surface 13P (Fig 6 a & b). Ds: Soil Diffusion Coefficient z Daily Mean 13PAh [‰] Production isotopic signature determination: a) Parameters: Ds(SWC,T), horizon thickness , surface [12CO2] and [13CO2] profile shape* Inputs: MeasuredProfiles of: [12CO2], [13CO2], SWC, Temperature (air, soil), Fs and13Fs * Fitted using Fs and 13Fs measurements An immediate effect of SWC and a delayed effect of VPD on 13PAh b) Daily Mean 13PAhC [‰] A delayed effect of VPD on 13PAhC Figure 7: a) The daily mean of PAh as SGT model output and as a function of soil water content and VPD (3 days before) measured respectively at -7 cm and above the canopy. b) The daily mean of PAhC as SGT model output and as a function of VPD (5 days before) measured above the canopy. . Figure 6: a) The correlation between the daily mean of (i) 13PAh(SGT Model) and (ii) measured soil water content at 7 cm depth (pvalue>0.001) b) The correlation between the daily mean of (i) measured 13Fsand (ii) SWC7 (pvalue>0.95) x: 12 or 13 Conclusions • Moisture conditions (SWC, VPD) are the main drivers of 13 of CO2 sources • 13PAh: immediateeffect of SWC and a delayedeffect of VPDDOY-3 • 13PAhC: delayedeffect of VPDDOY-5 • Soil CO2 source distribution is consistent with soil variable distribution (Corg, fine and coarse root numbers) • Temperature is the main driver of CO2 production, except in the Ol horizon. • Influences of moisture conditions on 13P are notdetectable from surface chamber measurements • SWC is the main driver of CO2 production in Ol horizon and diffuse transport seems not sufficient to simulate it This research was funded by The FRS-FNRS, Belgium October 2009 - October 2012 Contact Person: Goffin Stéphanie- University of Liege – Gembloux Agro-Bio Tech (GxABT) - Unit of Biosystem Physics, 8 Avenue de la Faculté - 5030 Gembloux - Belgium Tel : +32 (0)81 62 24 90 - Fax : +32 (0)81 62 24 39 e-mail : stephanie.goffin@ulg.ac.be