Download
1 / 1
10 likes | 99 Vues
NOAA Blended Analysis of Surface Salinity: Preliminary Results. P.Xie 1 ) , T. Boyer 2 ) , E. Bayler 3 ) , Y. Xue 1 ) , D . Byrne 2 ) , J.Reagan 2 ) , R. Locarnini 2 ) , and A. Kumar 1 ).

E N D
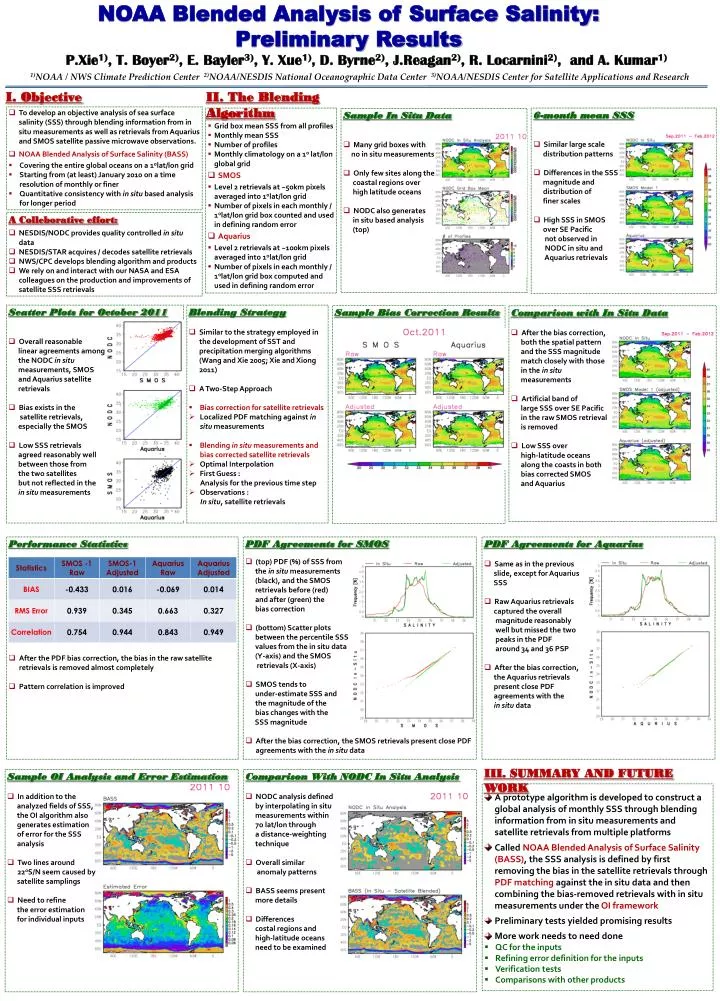
NOAA Blended Analysis of Surface Salinity: Preliminary Results P.Xie1), T. Boyer2), E. Bayler3), Y. Xue1), D. Byrne2), J.Reagan2), R. Locarnini2), and A. Kumar1) 1)NOAA / NWS Climate Prediction Center 2)NOAA/NESDIS National Oceanographic Data Center 3)NOAA/NESDIS Center for Satellite Applications and Research I. Objective II. The Blending Algorithm • To develop an objective analysis of sea surface salinity (SSS) through blending information from in situ measurements as well as retrievals from Aquarius and SMOS satellite passive microwave observations. • NOAA Blended Analysis of Surface Salinity (BASS) • Covering the entire global oceans on a 1olat/lon grid • Starting from (at least) January 2010 on a time resolution of monthly or finer • Quantitative consistency with in situ based analysis for longer period • In situ • Grid box mean SSS from all profiles • Monthly mean SSS • Number of profiles • Monthly climatology on a 1olat/lon global grid • SMOS • Level 2 retrievals at ~50km pixels averaged into 1olat/lon grid • Number of pixels in each monthly / 1olat/lon grid box counted and used in defining random error • Aquarius • Level 2 retrievals at ~100km pixels averaged into 1olat/lon grid • Number of pixels in each monthly / 1olat/lon grid box computed and used in defining random error • 6-month mean SSS • Similar large scale • distribution patterns • Differences in the SSS • magnitude and • distribution of • finer scales • High SSS in SMOS • over SE Pacific • not observed in • NODC in situ and • Aquarius retrievals • Sample In Situ Data • Many grid boxes with • no in situ measurements • Only few sites along the • coastal regions over • high latitude oceans • NODC also generates • in situ based analysis • (top) • A Colleborative effort: • NESDIS/NODC provides quality controlled in situ data • NESDIS/STAR acquires / decodes satellite retrievals • NWS/CPC develops blending algorithm and products • We rely on and interact with our NASA and ESA colleagues on the production and improvements of satellite SSS retrievals • Blending Strategy • Similar to the strategy employed in the development of SST and precipitation merging algorithms (Wang and Xie 2005; Xie and Xiong 2011) • A Two-Step Approach • Bias correction for satellite retrievals • Localized PDF matching against in situ measurements • Blending in situ measurements and bias corrected satellite retrievals • Optimal Interpolation • First Guess : • Analysis for the previous time step • Observations : • In situ, satellite retrievals • Scatter Plots for October 2011 • Overall reasonable • linear agreements among • the NODC in situ • measurements, SMOS • and Aquarius satellite • retrievals • Bias exists in the • satellite retrievals, • especially the SMOS • Low SSS retrievals • agreed reasonably well • between those from • the two satellites • but not reflected in the • in situ measurements • Sample Bias Correction Results • Comparison with In Situ Data • After the bias correction, • both the spatial pattern • and the SSS magnitude • match closely with those • in the in situ • measurements • Artificial band of • large SSS over SE Pacific • in the raw SMOS retrieval • is removed • Low SSS over • high-latitude oceans • along the coasts in both • bias corrected SMOS • and Aquarius • Performance Statistics • After the PDF bias correction, the bias in the raw satellite retrievals is removed almost completely • Pattern correlation is improved • PDF Agreements for SMOS • (top) PDF (%) of SSS from • the in situ measurements • (black), and the SMOS • retrievals before (red) • and after (green) the • bias correction • (bottom) Scatter plots • between the percentile SSS • values from the in situ data • (Y-axis) and the SMOS • retrievals (X-axis) • SMOS tends to • under-estimate SSS and • the magnitude of the • bias changes with the • SSS magnitude • After the bias correction, the SMOS retrievals present close PDF agreements with the in situ data • PDF Agreements for Aquarius • Same as in the previous • slide, except for Aquarius • SSS • Raw Aquarius retrievals • captured the overall • magnitude reasonably • well but missed the two • peaks in the PDF • around 34 and 36 PSP • After the bias correction, • the Aquarius retrievals • present close PDF • agreements with the • in situ data III. SUMMARY AND FUTURE WORK • Sample OI Analysis and Error Estimation • In addition to the • analyzed fields of SSS, • the OI algorithm also • generates estimation • of error for the SSS • analysis • Two lines around 22oS/N seem caused by • satellite samplings • Need to refine • the error estimationfor individual inputs • Comparison With NODC In Situ Analysis • NODC analysis defined • by interpolating in situ • measurements within • 7o lat/lonthrough • a distance-weighting • technique • Overall similar • anomaly patterns • BASS seems present • more details • Differences • costal regions and • high-latitude oceans • need to be examined • A prototype algorithm is developed to construct a global analysis of monthly SSS through blending information from in situ measurements and satellite retrievals from multiple platforms • Called NOAA Blended Analysis of Surface Salinity (BASS), the SSS analysis is defined by first removing the bias in the satellite retrievals through PDF matching against the in situ data and then combining the bias-removed retrievals with in situ measurements under the OI framework • Preliminary tests yielded promising results • More work needs to need done • QC for the inputs • Refining error definition for the inputs • Verification tests • Comparisons with other products