Download
1 / 47
470 likes | 587 Vues
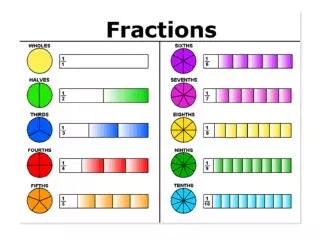
How do you use MAP data?. DART Statements. I know the best reports for teacher/student use and how to use them ? I can use and teach someone else to use the “Class by RIT” report I can identify my students by RIT range I can use the DesCartes document to better target students needs.

E N D
DART Statements • I know the best reports for teacher/student use and how to use them ? • I can use and teach someone else to use the “Class by RIT” report • I can identify my students by RIT range • I can use the DesCartes document to better target students needs
Introduction to MAP • https://admin.na6.acrobat.com/_a203290506/mapbasics Created by educators for educators, MAP assessments provide detailed, actionable data about where each child is on their unique learning path. Because student engagement is essential to any testing experience, NWEA works with educators to create test items that interest children and help to capture detail about what they know and what they’re ready to learn. It’s information teachers can use in the classroom to help every child, every day.
Goal Descriptors Students’ RIT score Lexile Range Class Scores
RIT BANDS Students who have scored in that RIT band Goal Strands
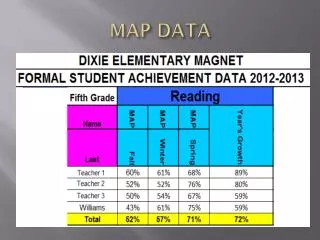
The report is divided up into sections according to subject areas: Math, Reading, Language Usage, and Science.
Student growth is also shown. This is done in year increments. The student’s score is the bold number in the middle, the numbers to the left and the right are the low and high end of the RIT Range. Each subject area lists all of the students scores from the first test to the most recent term that was selected.
4. Select “View by Goal Descriptors 5. Hit Submit
Directions for Class by RIT
1. Log onto the NWEA website: www.nwea.org 2. Select “Class by RIT”
3. Select the term 4. Select Class 5. Select Submit
RIT BANDS Students who have scored in that RIT band To get a better insight into each subject area, select that subject. (Note: This can only be done when it is created on the website; you cannot manipulate the information if it is in PDF format.) SUBJECT
Directions for Class Roster
1. Log onto the NWEA website: www.nwea.org 2. Select “Class Rosters”
Select the term you wish to view. If you select a previous term, you will receive this screen…
4. Select the class you want to view (if applicable) 5. Select “Submit”
Select the appropriate choices: -Range of Testing Windows -Text, Graph, or Both -Extra information to be included
If you want a PDF of your entire class, select the class name . If you want a PDF for an individual student, select their name
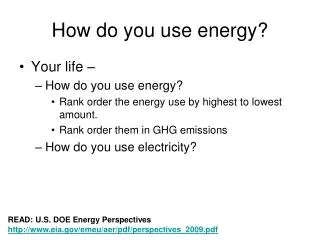
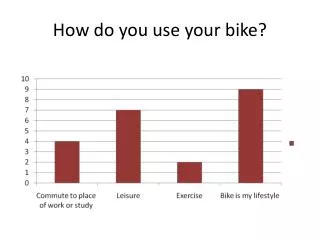
You have 60 students in your classes that are below grade level in your subject area. What do you need to know in order to help them improve? Chart
Let’s look at what our reports can tell us. Class by RIT
Math-196Reading-236 Inst Level 3 Inst Level 10+
What does this report tell me? • Overall Instructional Level in Math, Reading & Language • Instructional Level by Goal (Subdomain) in all areas • Visual Comparison in Relation to Peers • Let’s me determine if reading is an issue with understanding
OK…I now know that B. Smith is low in math I know that Algebra and Functions is the lowest subdomain What does B. Smith know about Algebra and Functions? What doesn’t B. Smith know?
What is DesCartes? • The purpose of DesCartes is to help guide instruction based on reports from an NWEA Achievement Level Test or computerized Measures of Academic Progress assessment. DesCartes enhances a teacher’s ability to provide targeted instruction for individual students or groups of students.
How to access DesCartes • 2. Select DeCartes 1. Log onto the NWEA website: www.nwea.org
MAP Analysis • Meet with departments to identify students below grade level for reading ,math and language arts. . • Use Descartes to develop a plan to help those below grade level progress.