Download
1 / 26
270 likes | 406 Vues
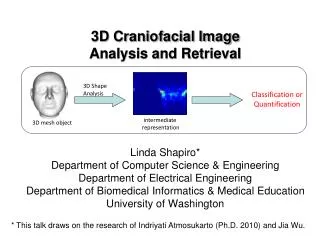
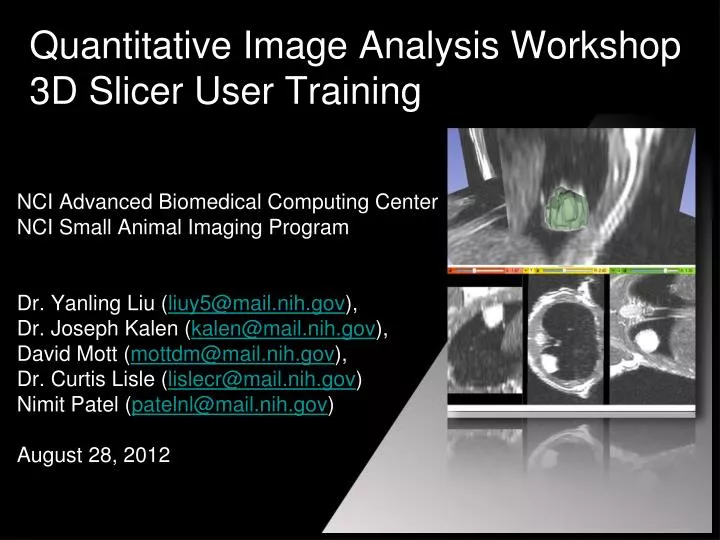
Quantitative Image Analysis Workshop 3D Slicer User Training. NCI Advanced Biomedical Computing Center NCI Small Animal Imaging Program Dr. Yanling Liu ( liuy5@mail.nih.gov ), Dr. Joseph Kalen ( kalen@mail.nih.gov ), David Mott ( mottdm@mail.nih.gov ),

E N D
Quantitative Image Analysis Workshop3D Slicer User Training • NCI Advanced Biomedical Computing Center • NCI Small Animal Imaging Program • Dr. Yanling Liu (liuy5@mail.nih.gov), • Dr. Joseph Kalen (kalen@mail.nih.gov), • David Mott (mottdm@mail.nih.gov), • Dr. Curtis Lisle (lislecr@mail.nih.gov) • Nimit Patel (patelnl@mail.nih.gov) • August 28, 2012
Training Agenda • Access to Slicer: Slicer website and SAIP remote desktop • Working the Slicer user interface: adjusting image views, window/level, image threshold, and UI layout • Basic dataset input/output: How to load a volume for analysis, save out results, and resume session later. • ROI: Definition and uses of Region of Interest selection in Slicer; volume cropping • Segmentation: selecting and measuring volumes
3D Slicer Website • 3D Slicer has been developed over years with contributions from over 20 universities and funding from multiple NIH research grants • The website, http://www.slicer.org, hosts the program itself and many additional resources, datasets, and training materials • Slicer is available for Windows, Mac, and Linux workstations • SAIP remote desktop • Microsoft Remote Desktop connection with machine name saip-remote.ncifcrf.gov “Download” link “For Users” link offers additional tutorials slicer.org slicer download page
The Slicer User Interface • By default, Slicer offers slice views and a 3D perspectiveview of loaded datasets • An operation panel on the top left lets users select from different Slicer modules, each offering sets of related operations • volume display • segmentation • Region Of Interest
Slicer User Interface • Module controls are placed along the top menu select the module to use show volume info select user interface layout module history menu load/save data add fiducial points or measurements module back & forward buttons
Dataset Input / Output • Add Data - The simplest way to view a new volume, image, or other data with Slicer the file loading dialog: • Even if the dataset is stored in multiple files, select the first slice only and click Open
Exercise #1 • Start up Slicer • Explore the selection of different modules • Change the layout back and forth between a single axial slice (red, green, or yellow) and back to the standard layout • Open the sample dataset so it shows in the axial windows
Displaying a Volume • step #1: Select from presets to quickly adjust the image contrast • If step #1 does not provide a good contrast, the Window / Level can be adjusted for fine control, but this control can be hard to use • Easier way: Click & hold left mouse button, drag mouse cursor in slice view to change window/level
Working with Slice Views • A little pop-down menu controls the behavior of each slice view Move the slice back & forth within the volume labelmap to display as overlay Display slice in 3D view Should controls apply to ALL slice views (linked mode) Background (standard) volume being observed by slice viewer
A Lightbox view of a Volume • To view a volume using a lightbox display (display all slices), select a slice view (e.g. red, green, or yellow), then expand the drop-down control panel • The push pin icon fastens the panel open when it is selected • Select the desired lightbox mode (e.g. 3x3). • Moving the mouse up & down in the window scrolls through the dataset lightbox icon this expands the control panel
Saving a Slicer Session • Slicer saves progress of analysis sessions in a supplementary file with the “.mrml” extension. We recommend creating a new directory on the workstation, then saving the data and .mrml files all within this directory • step #1 - select the Save Data icon • step #2 - in the save window, select the “force all data to be saved” checkbox • step #3 - select the new output directory and click the Save button (shown on next slide) The result is the data and scene stored together in a single directory
File Save Dialog • Save dialog generally saves only files that have been modified since last save; files to be saved are marked with a check mark • Forcing a save into a new directory assures all components of a scene are stored together. Click here to open dialog and select or create directory to save to
Exercise #2 • Practice adjusting the contrast and window/level view of the current volume • select different slice views and enable/disable the lightbox view • Save the current session • Create a new output directory • Save the session into the new directory by forcing save on all items and clicking the Save button • Restart Slicer and load the saved session
Segmenting Image Features • Slicer has several ways to select features in an image (for example, to mark a tumor and calculate its size) • We want to label all pixels occupied by each feature with a unique number (for example: assign tumor pixels label of 1) • Labels are stored as labelmaps (an image where each spot in the image is the label number label value = 1 inside tumor label value = 0 outside + label shown in context feature to segment labelmap
First Crop the Volume • Automatic segmentation algorithms can become confused easily between a tumor and healthy tissue • Therefore, we will create a small volume containing only the tumor and as little else as possible • Select the Crop Volume module a small volume containing only the tumor
Crop Volume Module • This module creates a new, smaller dataset containing only what is inside an adjustable bounding box • select Input, default is current volume • Select Create new ROI • enable ROI (region of interest) visibility • Adjust ROI • Isotropic gives best results • Select Crop button to create a new volume
Adjusting the ROI • Observe the bounding box in the 2D slice views • Click and drag the outlines on any slice (or the perspective display) until the ROI contains only the feature of interest • Zooming and moving around in views will help • Right mouse button and drag down zooms in • Shift + right button drag moves the views click & drag any dot
Exercise #3 • Practice zooming and moving around in the 2D views • Select the Crop Volume module • Position the ROI until it as close around a feature as possible • Crop and notice how the viewers change to focus on the newly created volume • Practice switching between volumes being observed
Segmentation Options • Segmentation is complicated • Expect it to take awhile to master • Multiple choices in Slicer: • Grow/Cut operation in editor (works well but takes too long to explain today) • OTSU Segmentation • Simple Region Growing OTSU segmentation example in Slicer
OTSU Segmentation • An automatic algorithm to separate a volume into two classes: (1) feature and (2) everything else • Verify the input volume and that the correct ROI node is being observed • The input volume should be the output of the Crop volume operation • Create a new output volume for the labelmap
Determining Feature Volume • The Quantification / Label Statistics module will calculate the volume of the labels generated by OTSU segmentation • Select the input volume as the grayscale volume and select the labelmap output from the segmentation. • Hit Apply to generate the chart of volumes for each label
Exercise #4 • Run the OTSU Segmentation module on the dataset • Paint labels as necessary in the Editor module • Calculate the volume of the segmented feature
Training Session Summary • Segmentation results are often not perfect • In many cases, algorithms more sophisticated than OTSU are needed, or the segmentation will have to be hand edited later • This tutorial was designed to introduce everyone to dataset management and basic segmentation • The Small Animal Imaging Program and the ABCC Imaging and Visualization Group will gladly provide further assistance, as needed. • Thanks for attending the training session!
Grow/Cut Segmentation • Very powerful segmentation algorithm in Slicer • Requires use of the labelmap Editor module • User “smudges” labelmap value 1 inside the region of interest and value=2 outside area • Algorithm determines 3D boundary of area algorithm result user-provided guidance
Grow/Cut Process • In Editor, create a new labelmap • Select Paintbrush Icon with label=1; smudge a region inside the feature/organ • Change label value to label=2; smudge a region outside the feature • Click Grow/Cut icon • Select Apply button